0 Day Analytics
Active Installs
30+
Last Updated
May 28, 2026
First Released
April 10, 2025
Download History (Last one month)
Contributors
0 Day Analytics is a comprehensive WordPress debugging and operational
intelligence plugin. It is purpose-built for developers and site administrators
who need real-time visibility into their PHP errors, scheduled tasks, database
state, outgoing emails, HTTP requests, hook behaviour, and overall site health —
all from a single admin interface.
Unlike general monitoring services, 0 Day Analytics runs entirely inside your
WordPress installation with no third-party data collection. Every module is
opt-in and designed with performance in mind.
Plugin Website: 0-day-analytics.com
User Documentation: User Guide
Dashboard
A centralised overview page providing at-a-glance status for all active plugin
modules. Displays real-time widgets for Error Log, Fatal Errors, Cron Jobs,
Transients, HTTP Requests, WP Mail, REST API, and Security — each showing
key metrics and recent events. Toggle individual module widgets on or off.
The Dashboard is the default landing page when clicking the main plugin menu
item, giving administrators immediate visibility into site health and activity
without navigating to each module separately.
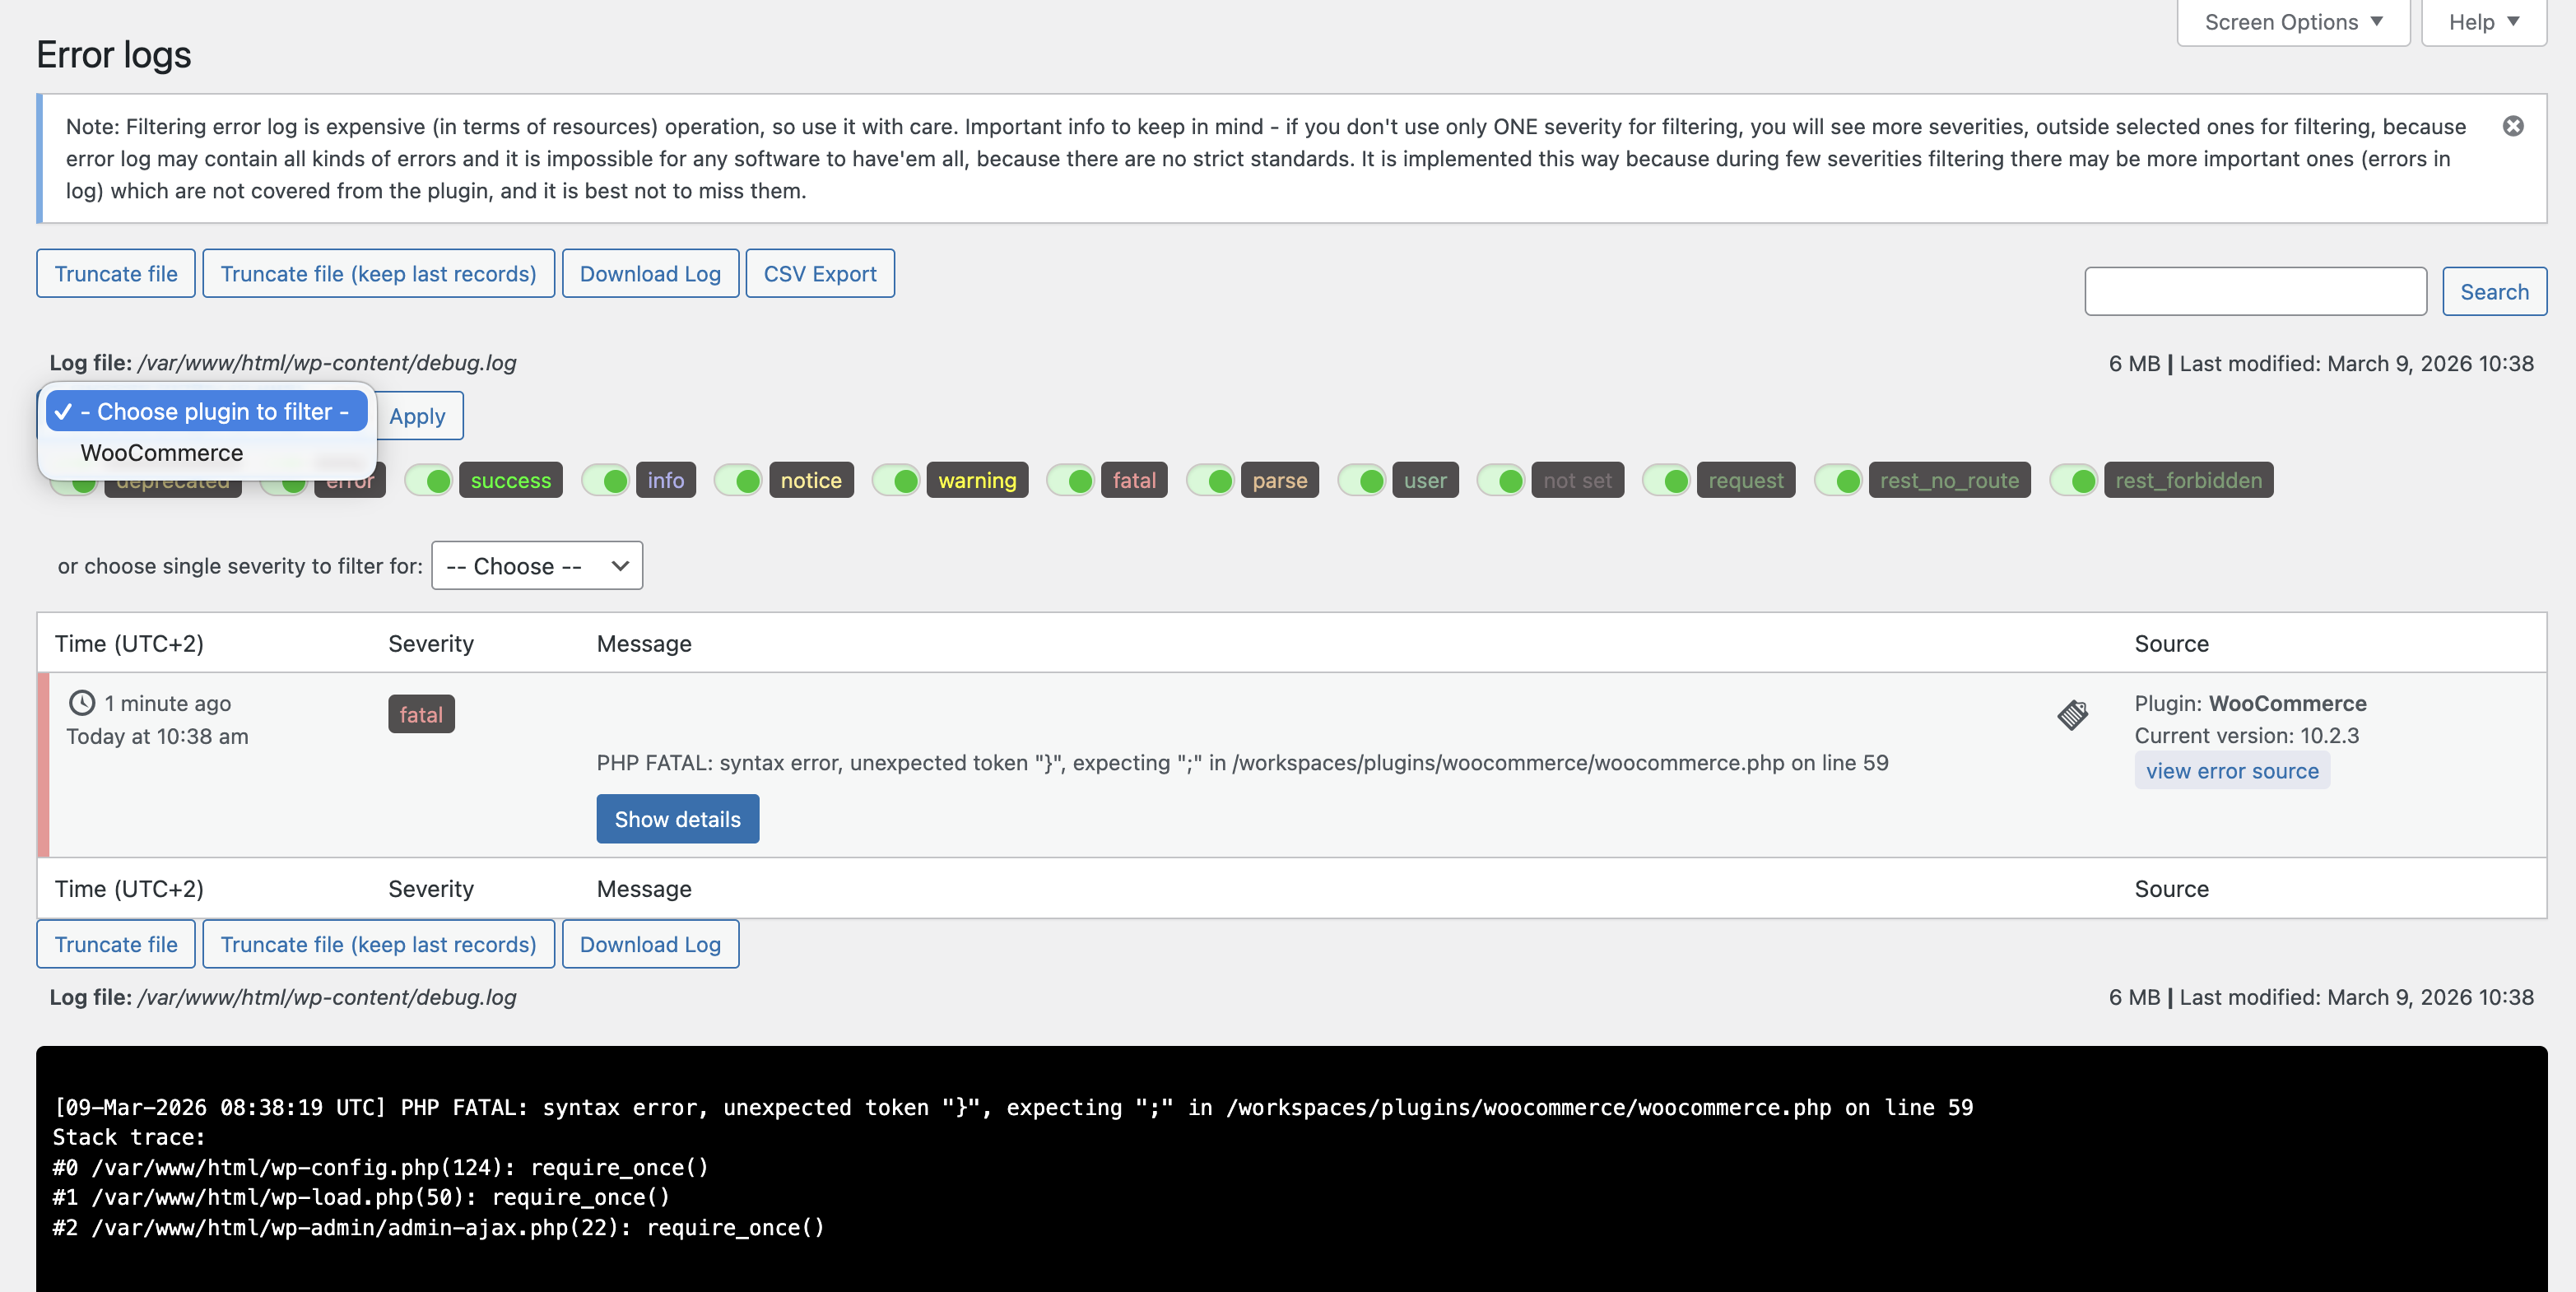
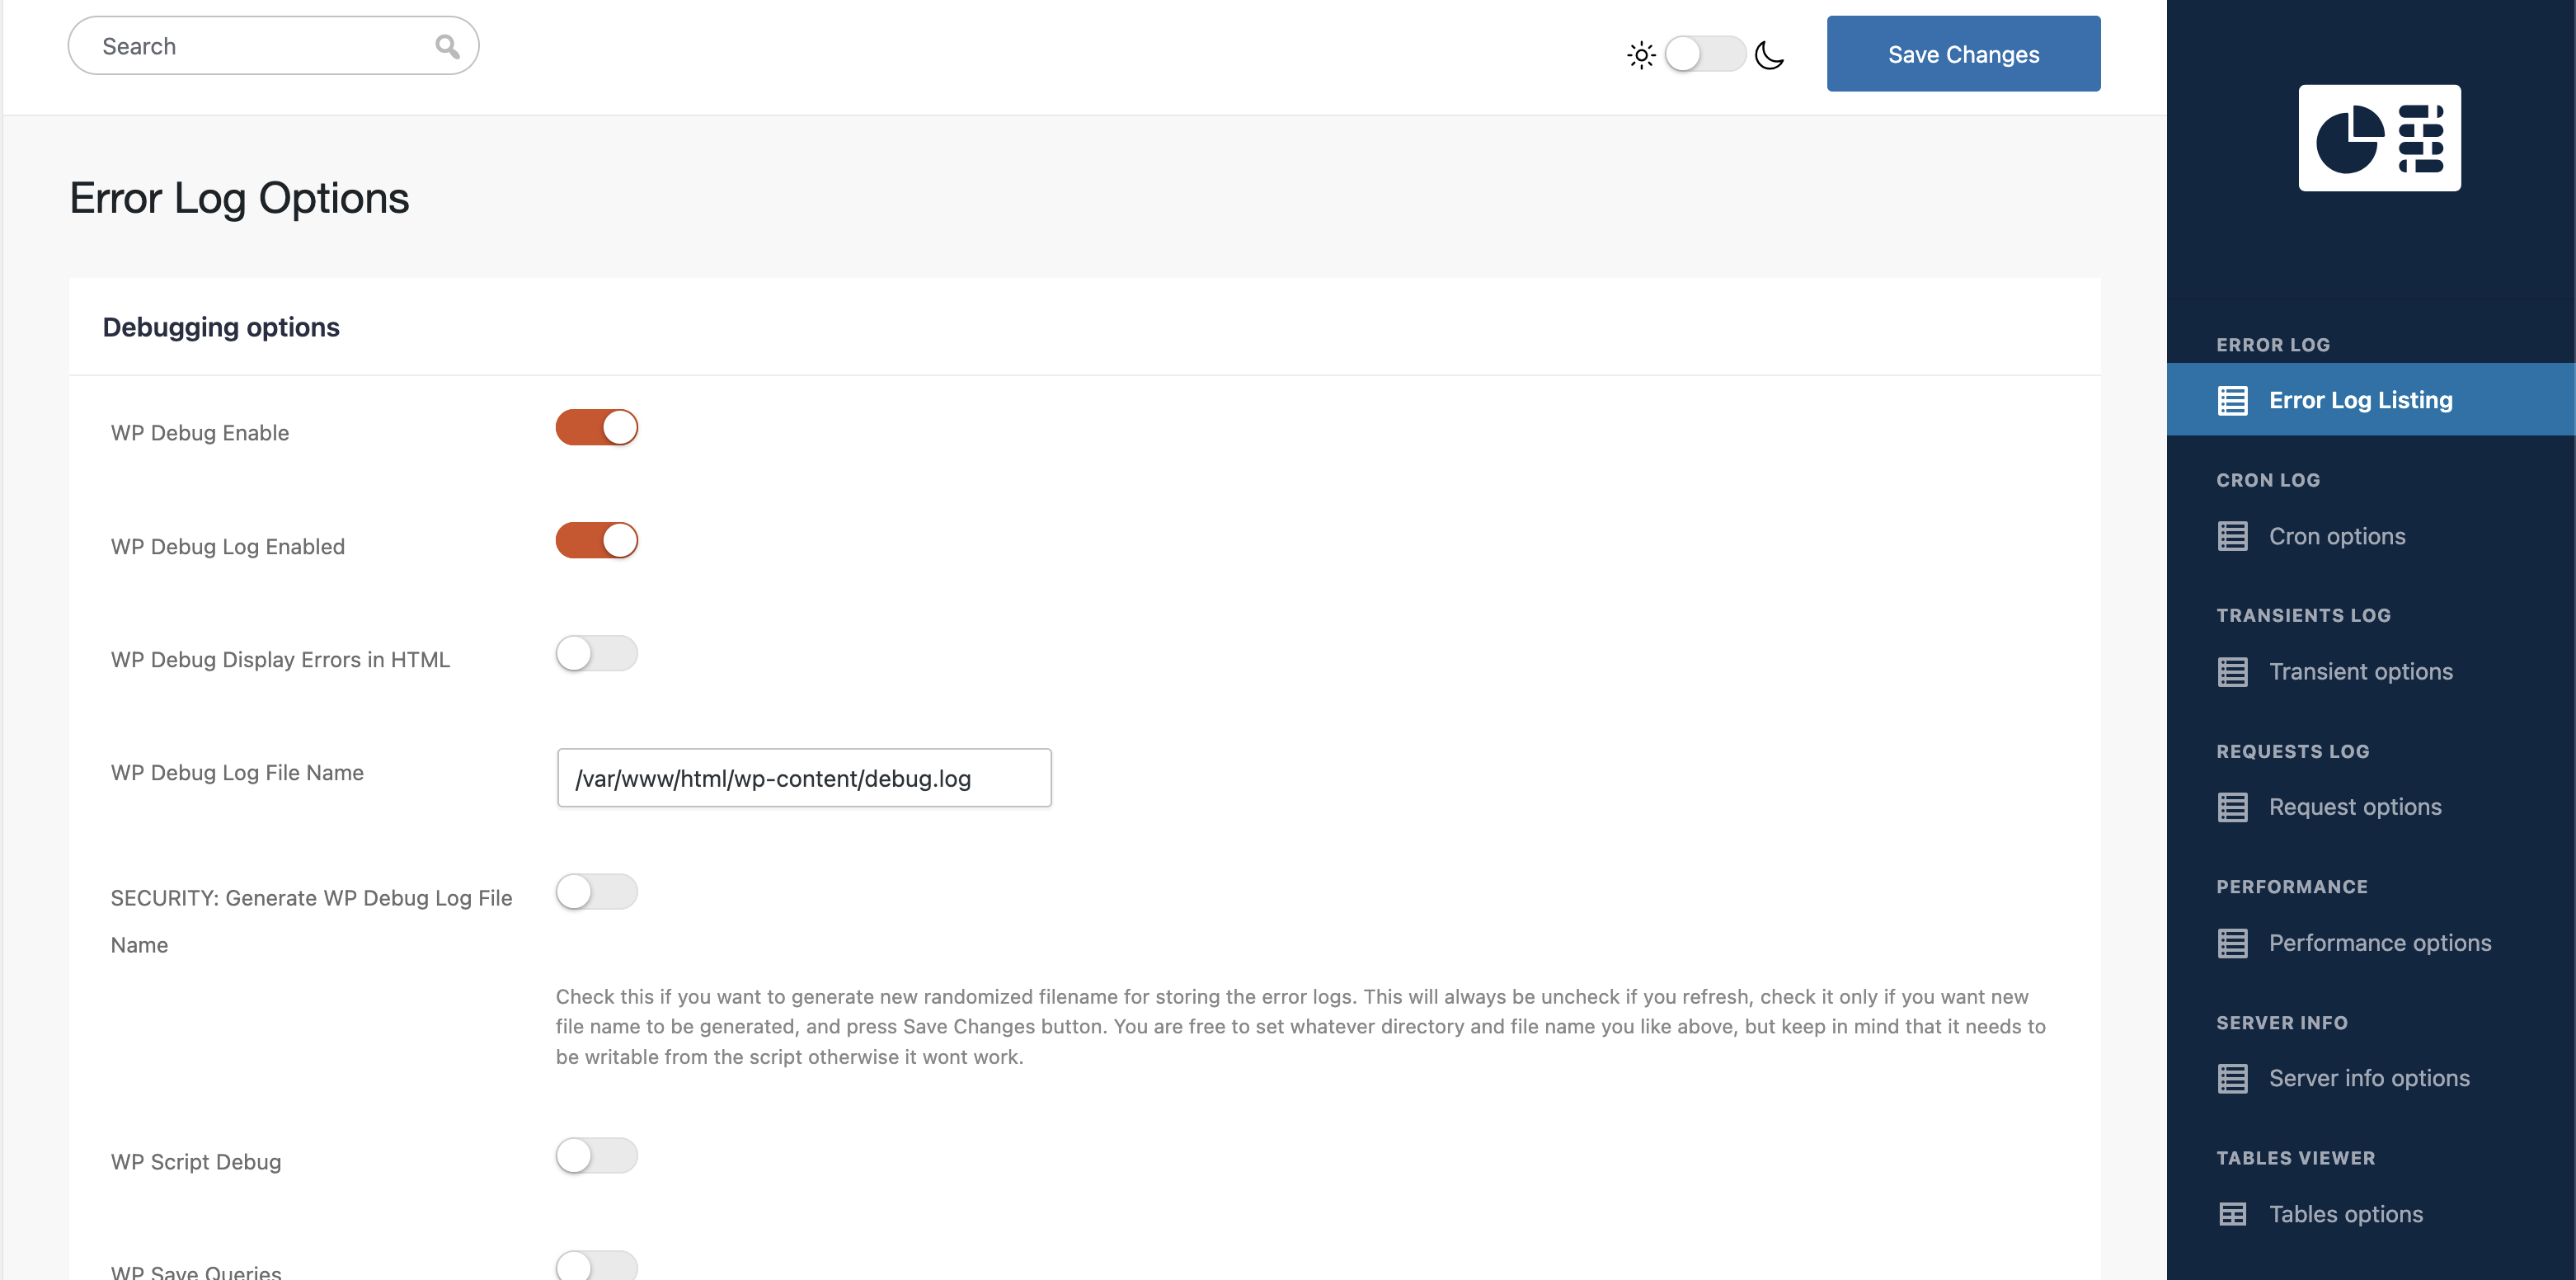
Error Log Manager
Read, search, filter, and manage your PHP/WordPress error log without leaving
the admin. Engineered for very large (GB-sized) logs using a reverse-line reader
that never performs a full-file read. Supports code-context viewing (click any
error to see the surrounding source), per-severity filtering, log truncation,
and download. Optionally randomise the log filename to reduce exposure.
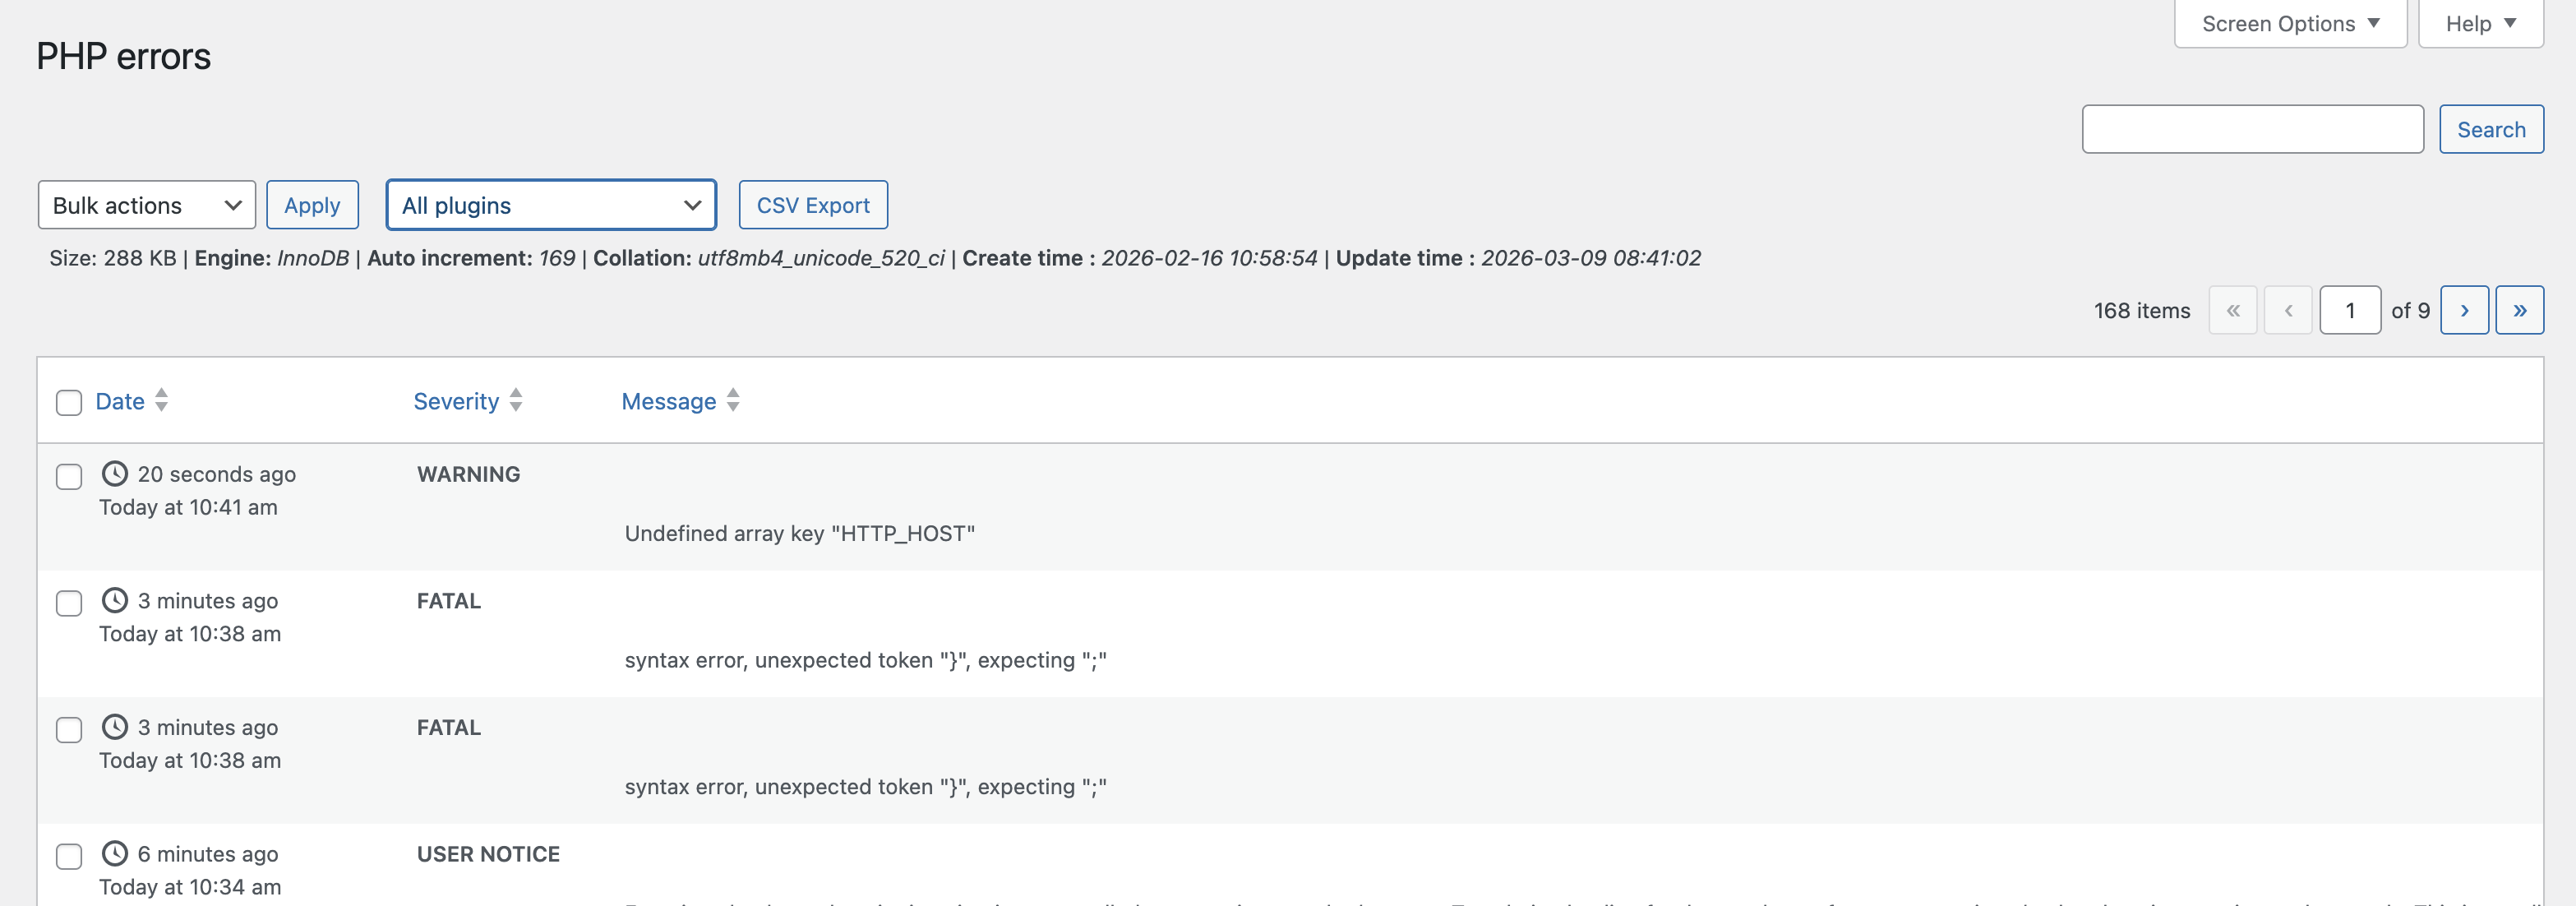
PHP Fatal Error Tracker
Captures and stores PHP fatal errors in a dedicated database table, it records PHP errors even if the WP_DEBUG is turned off so they persist even after the log is rotated or overwritten. Each record includes
error type, file, line, stack trace, and timestamp — searchable and filterable
directly in the admin.
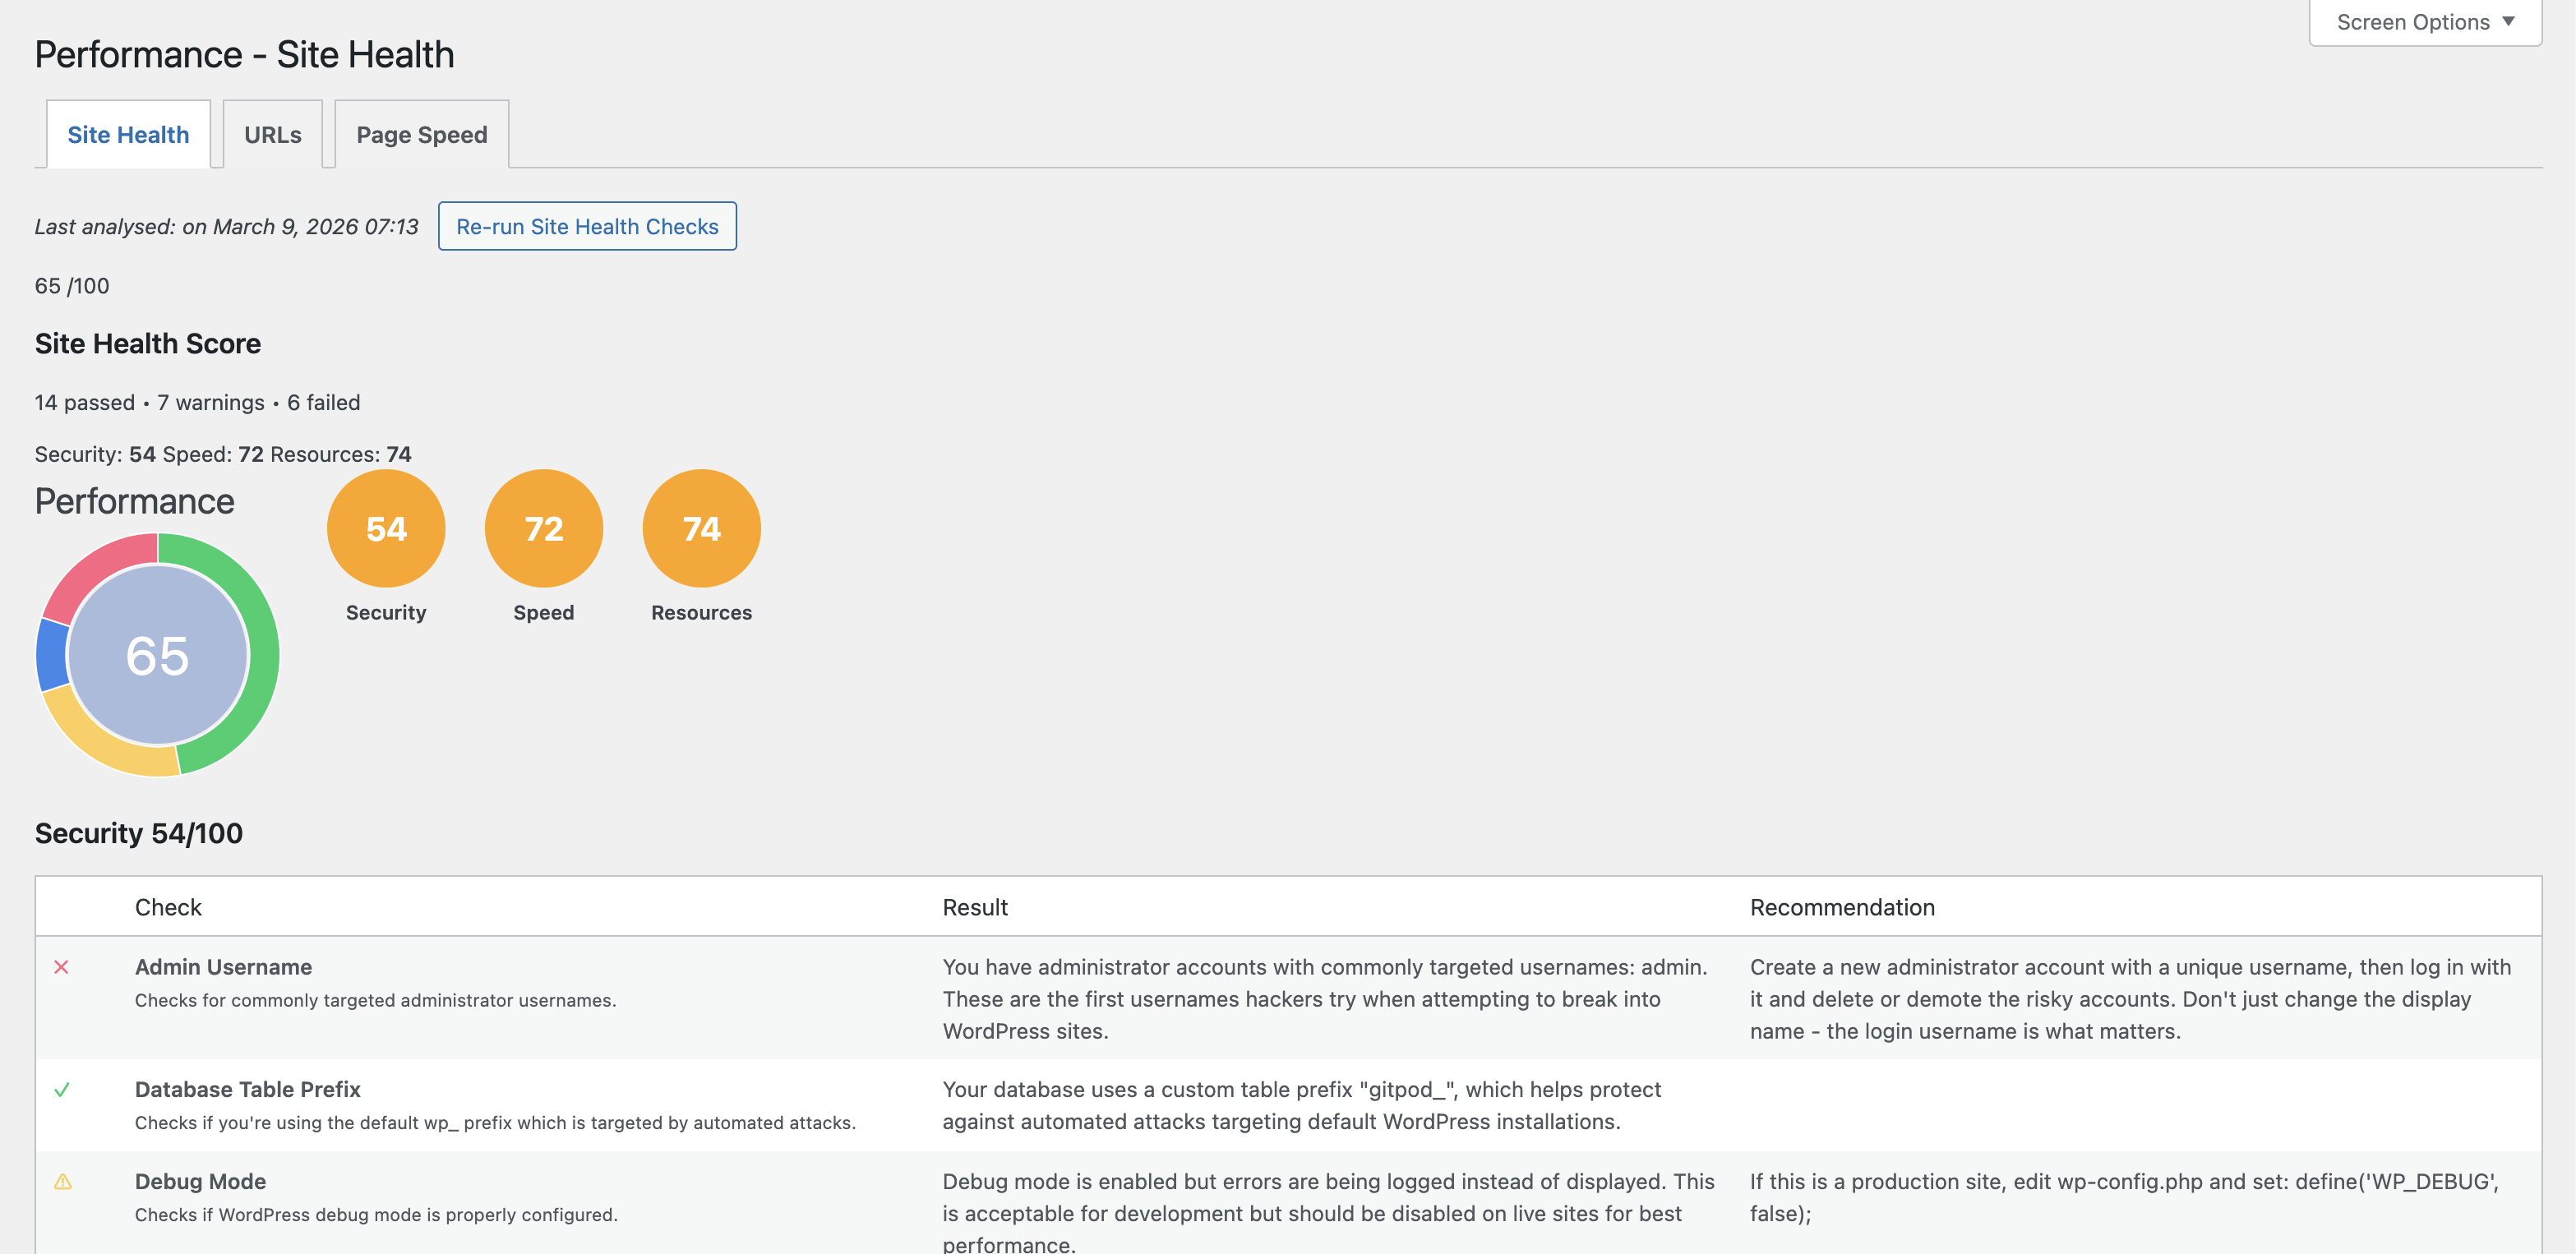
Site Performance & Security Scanner
Runs 32+ automated checks across three categories — Security, Speed, and
Resources used — and presents a scored dashboard with actionable
recommendations. Checks include: PHP version, WordPress version, SSL
certificate, debug mode exposure, file permissions, database prefix, XML-RPC,
login URL, active plugin count, autoloaded options, cron health, page caching,
object caching, gzip compression, lazy loading, image optimisation, and more.
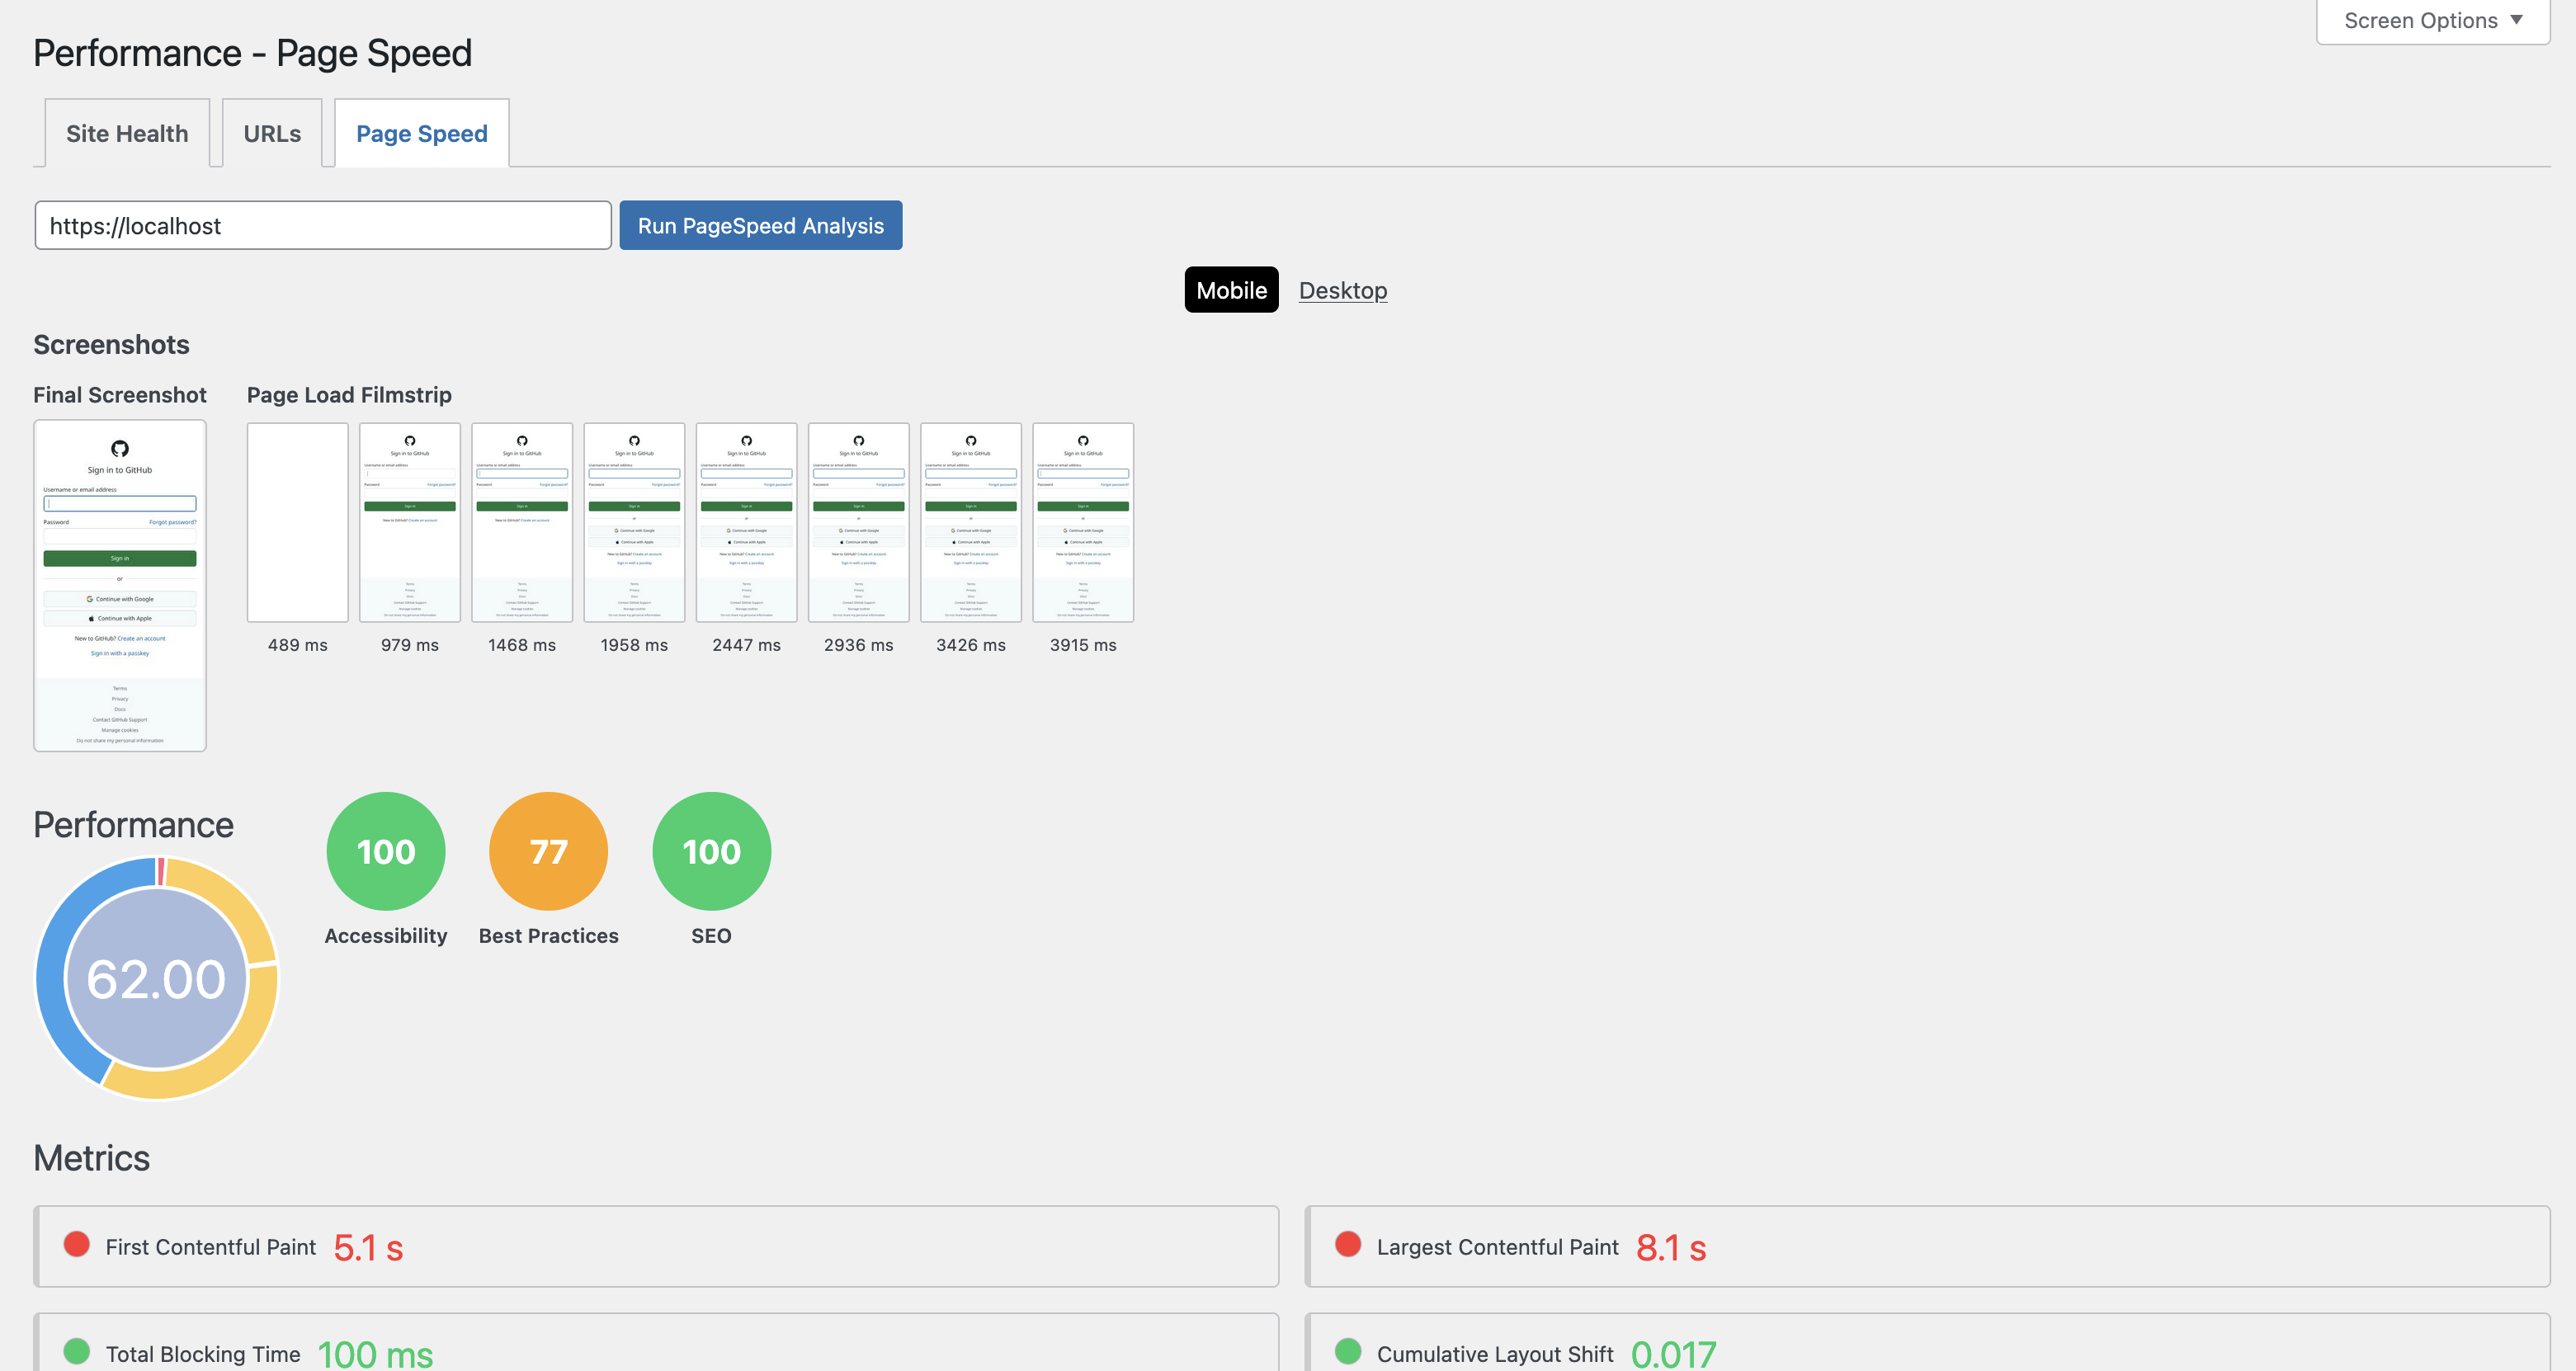
Google PageSpeed & Core Web Vitals
Analyse any URL directly from the WordPress admin using the Google PageSpeed
Insights API. Displays Performance, Accessibility, Best Practices, and SEO
scores with Lighthouse category breakdowns for both desktop and mobile. For that you need to provide your own PageSpeed Google API key.
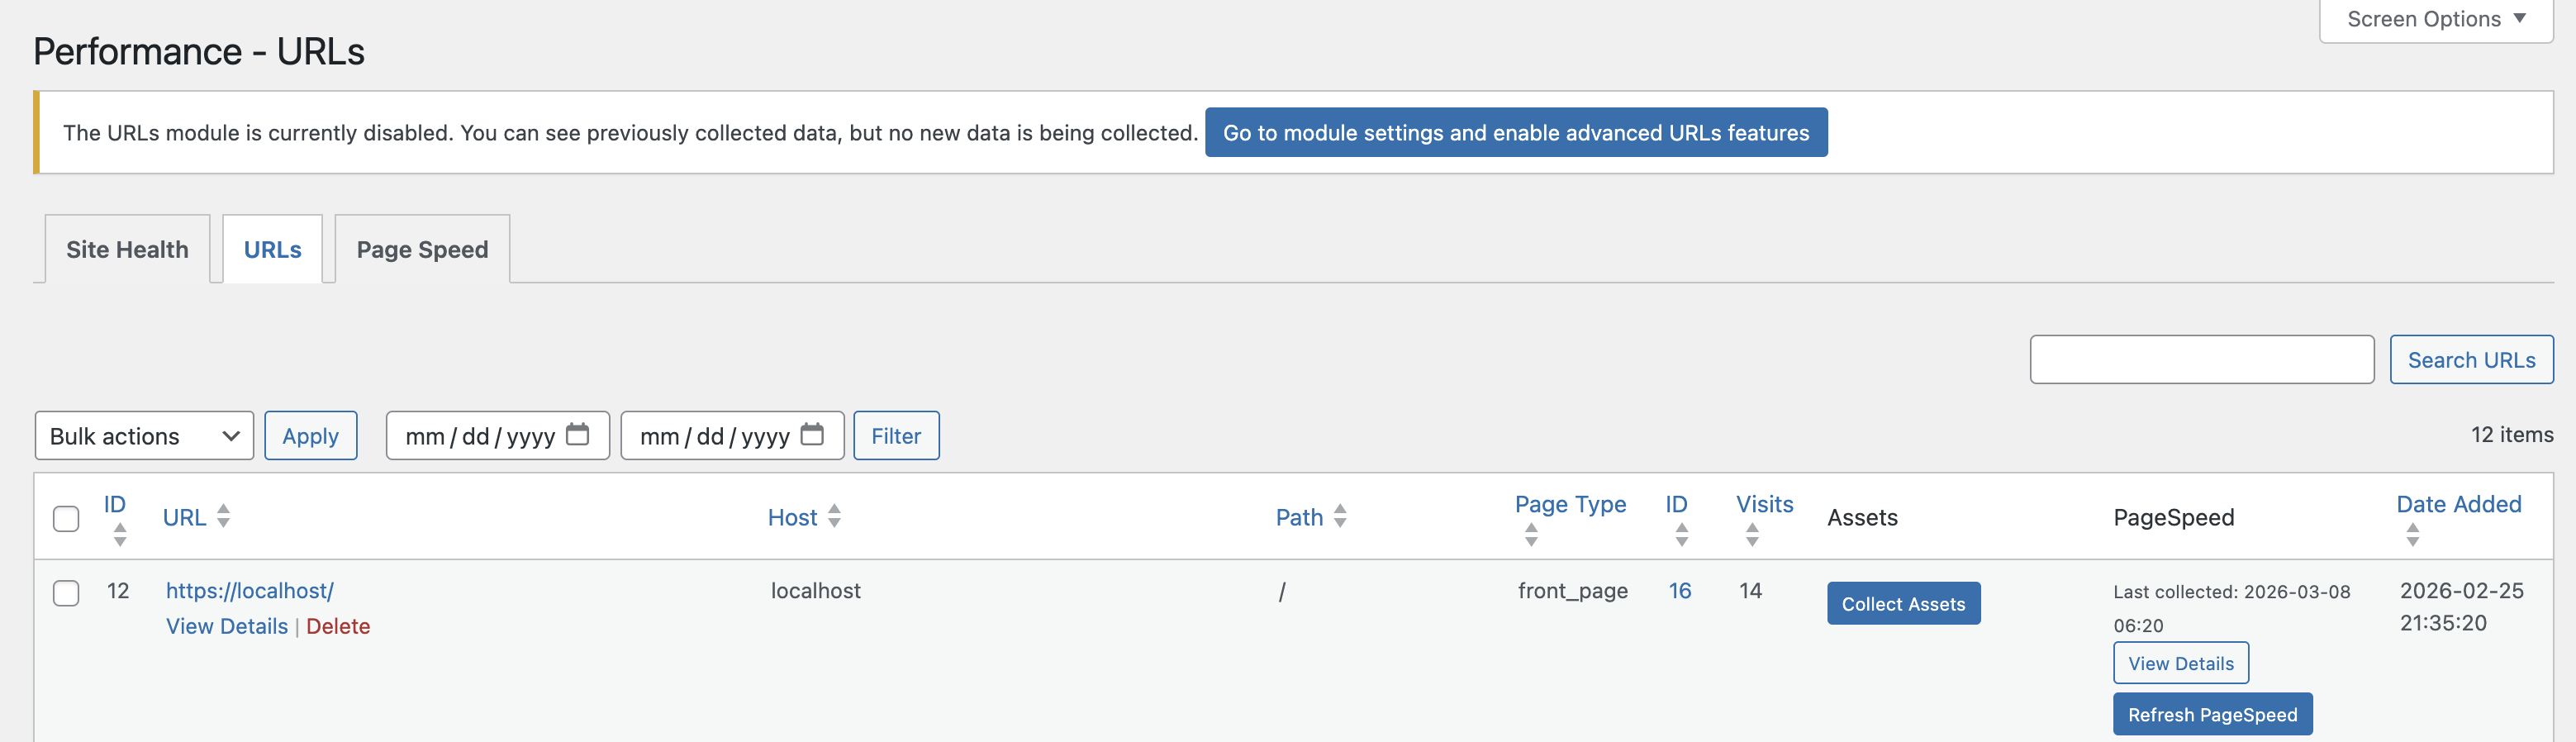
URL Tracker & Asset Analyser
Automatically tracks visited page URLs on your site. For each recorded URL,
you can collect all associated JS, CSS, and media assets (with file sizes), run
a Google PageSpeed analysis, and review visit counts — making it easy to audit
page weight and performance regressions over time.
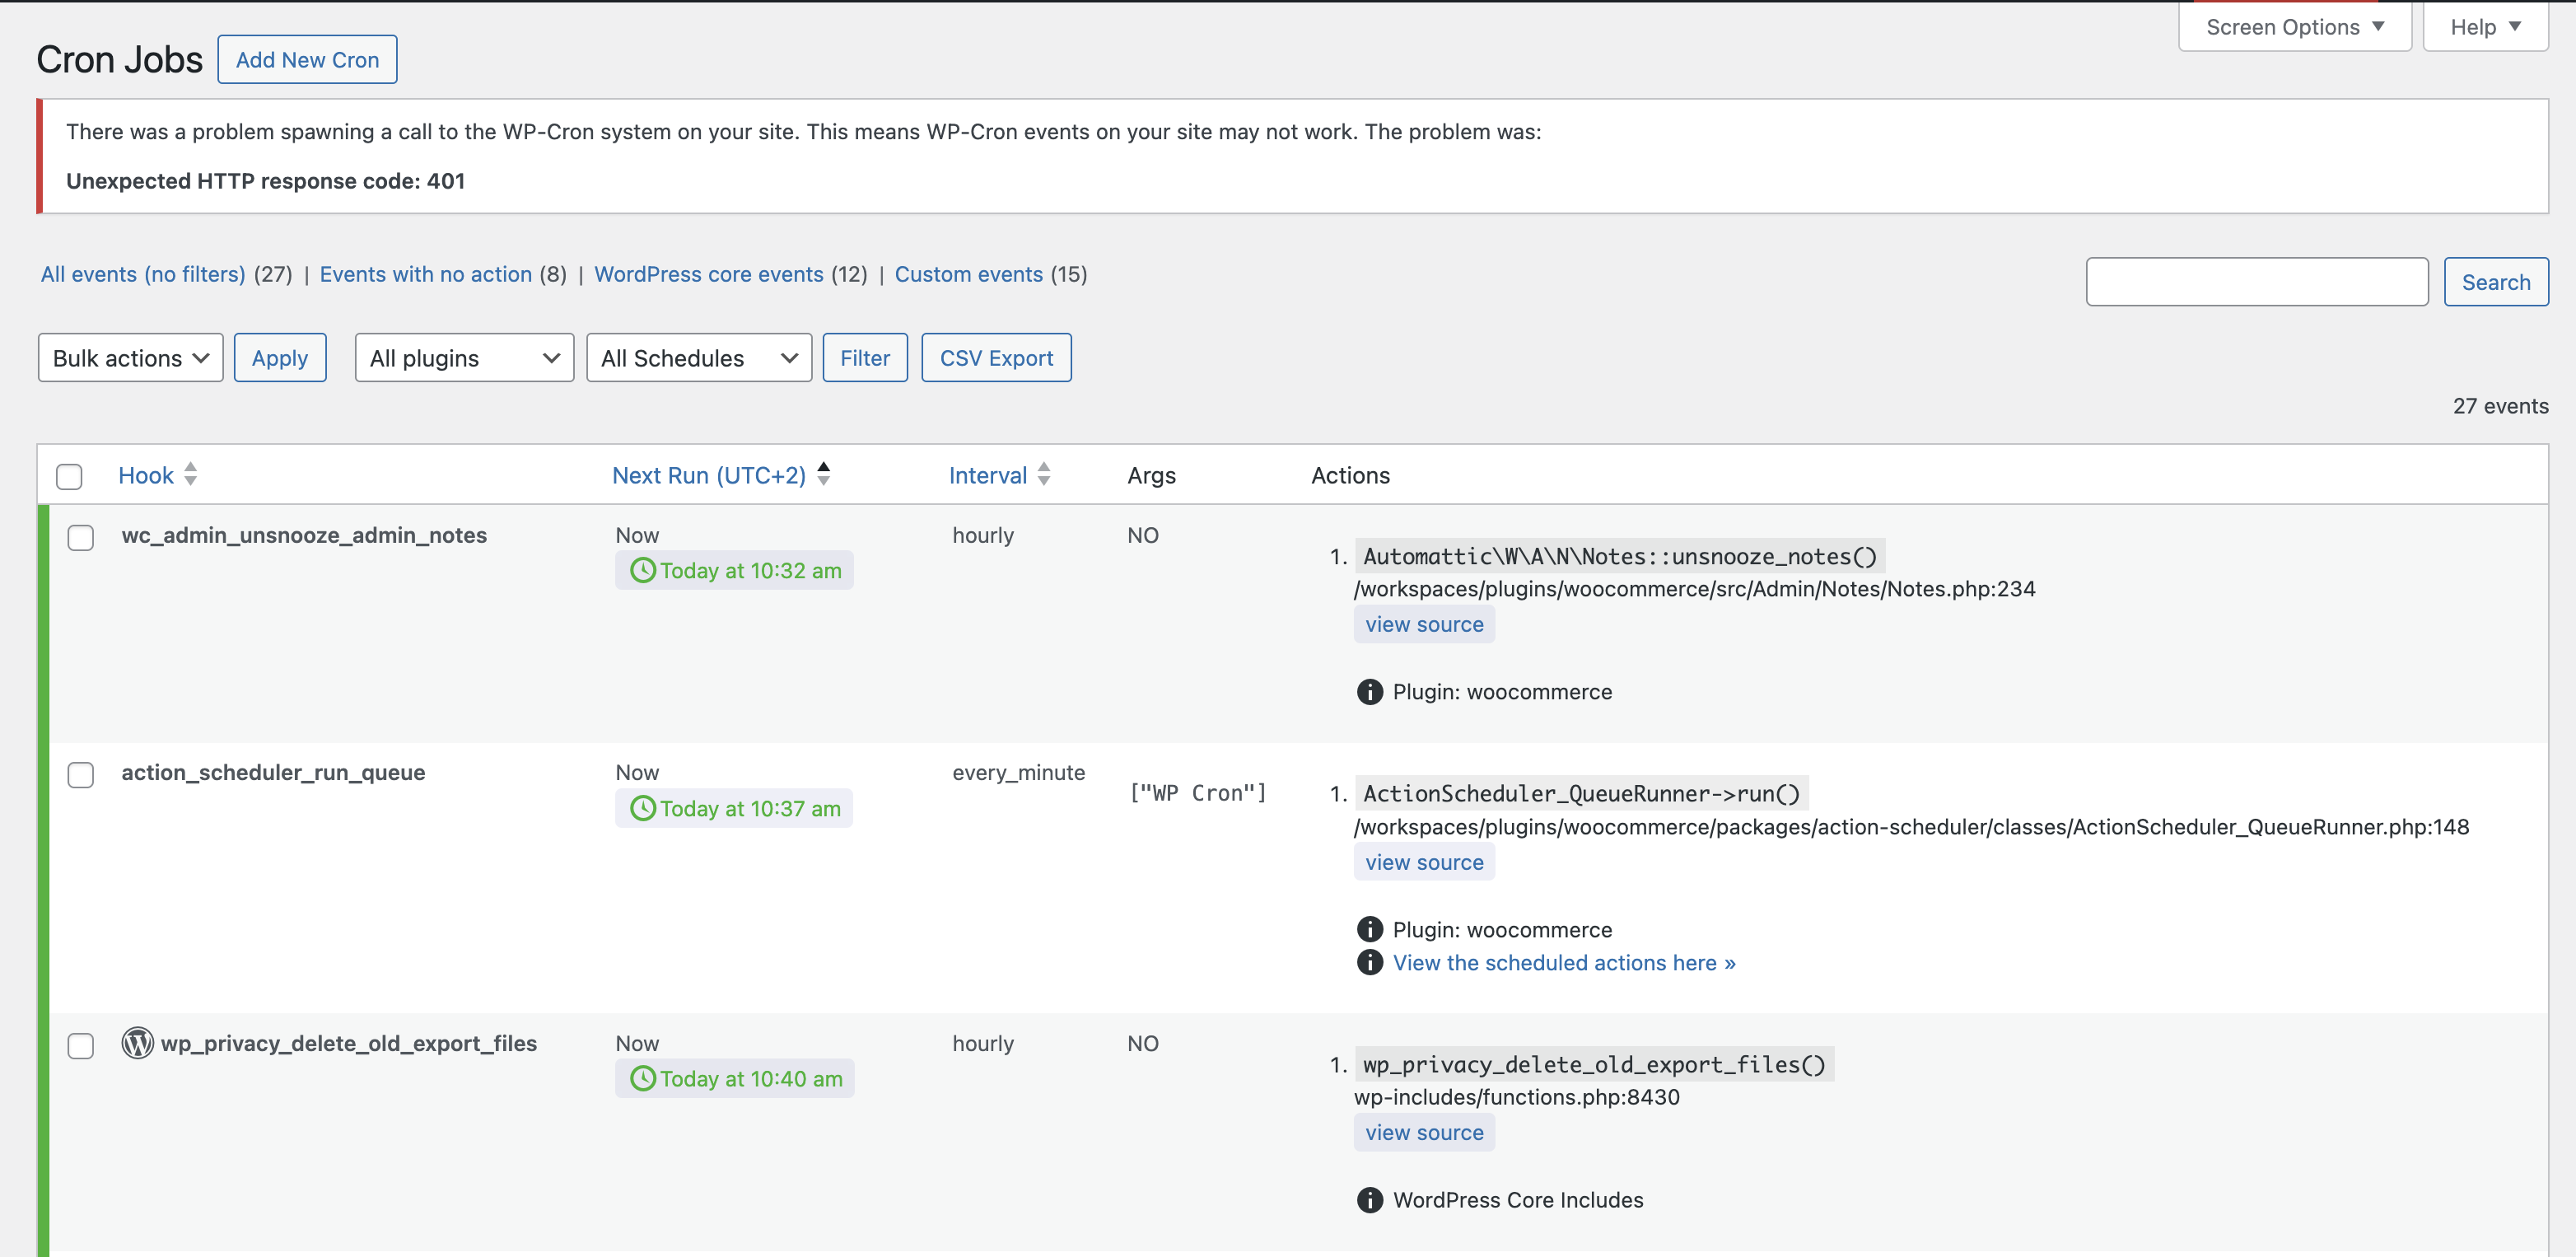
Cron Manager
View, search, edit, manually run, and delete WordPress scheduled tasks. Shows
next run time (UTC), recurrence interval, arguments, and last execution status.
Supports bulk actions and advanced filtering.
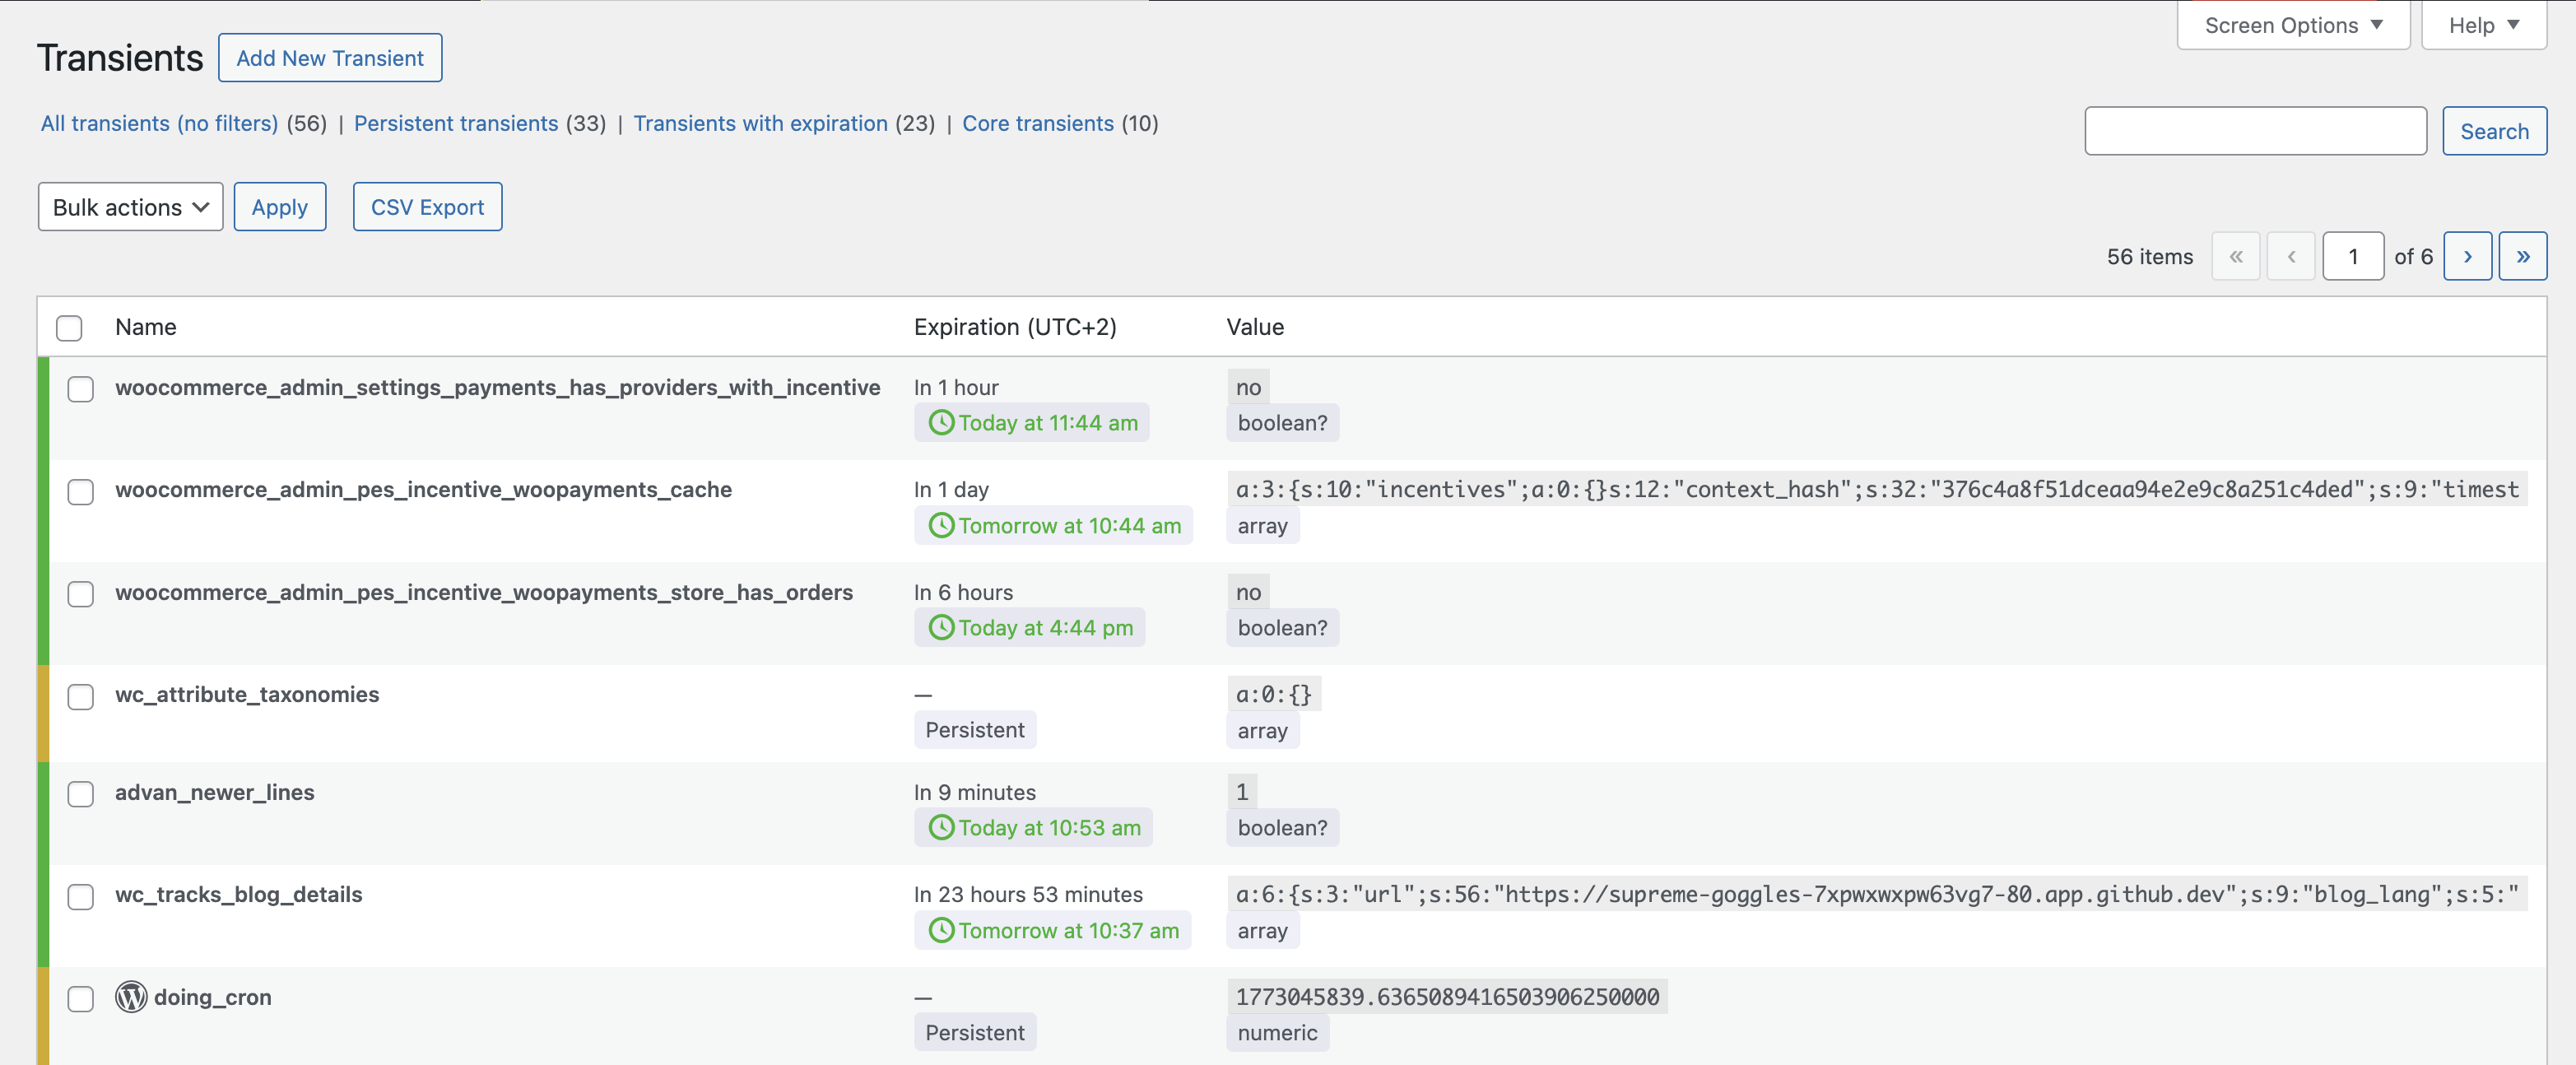
Transients Manager
Browse, search, edit, and safely delete database transients. Displays expiry
time, serialised value (pretty-printed), and size. Bulk delete supports
filtered selections.
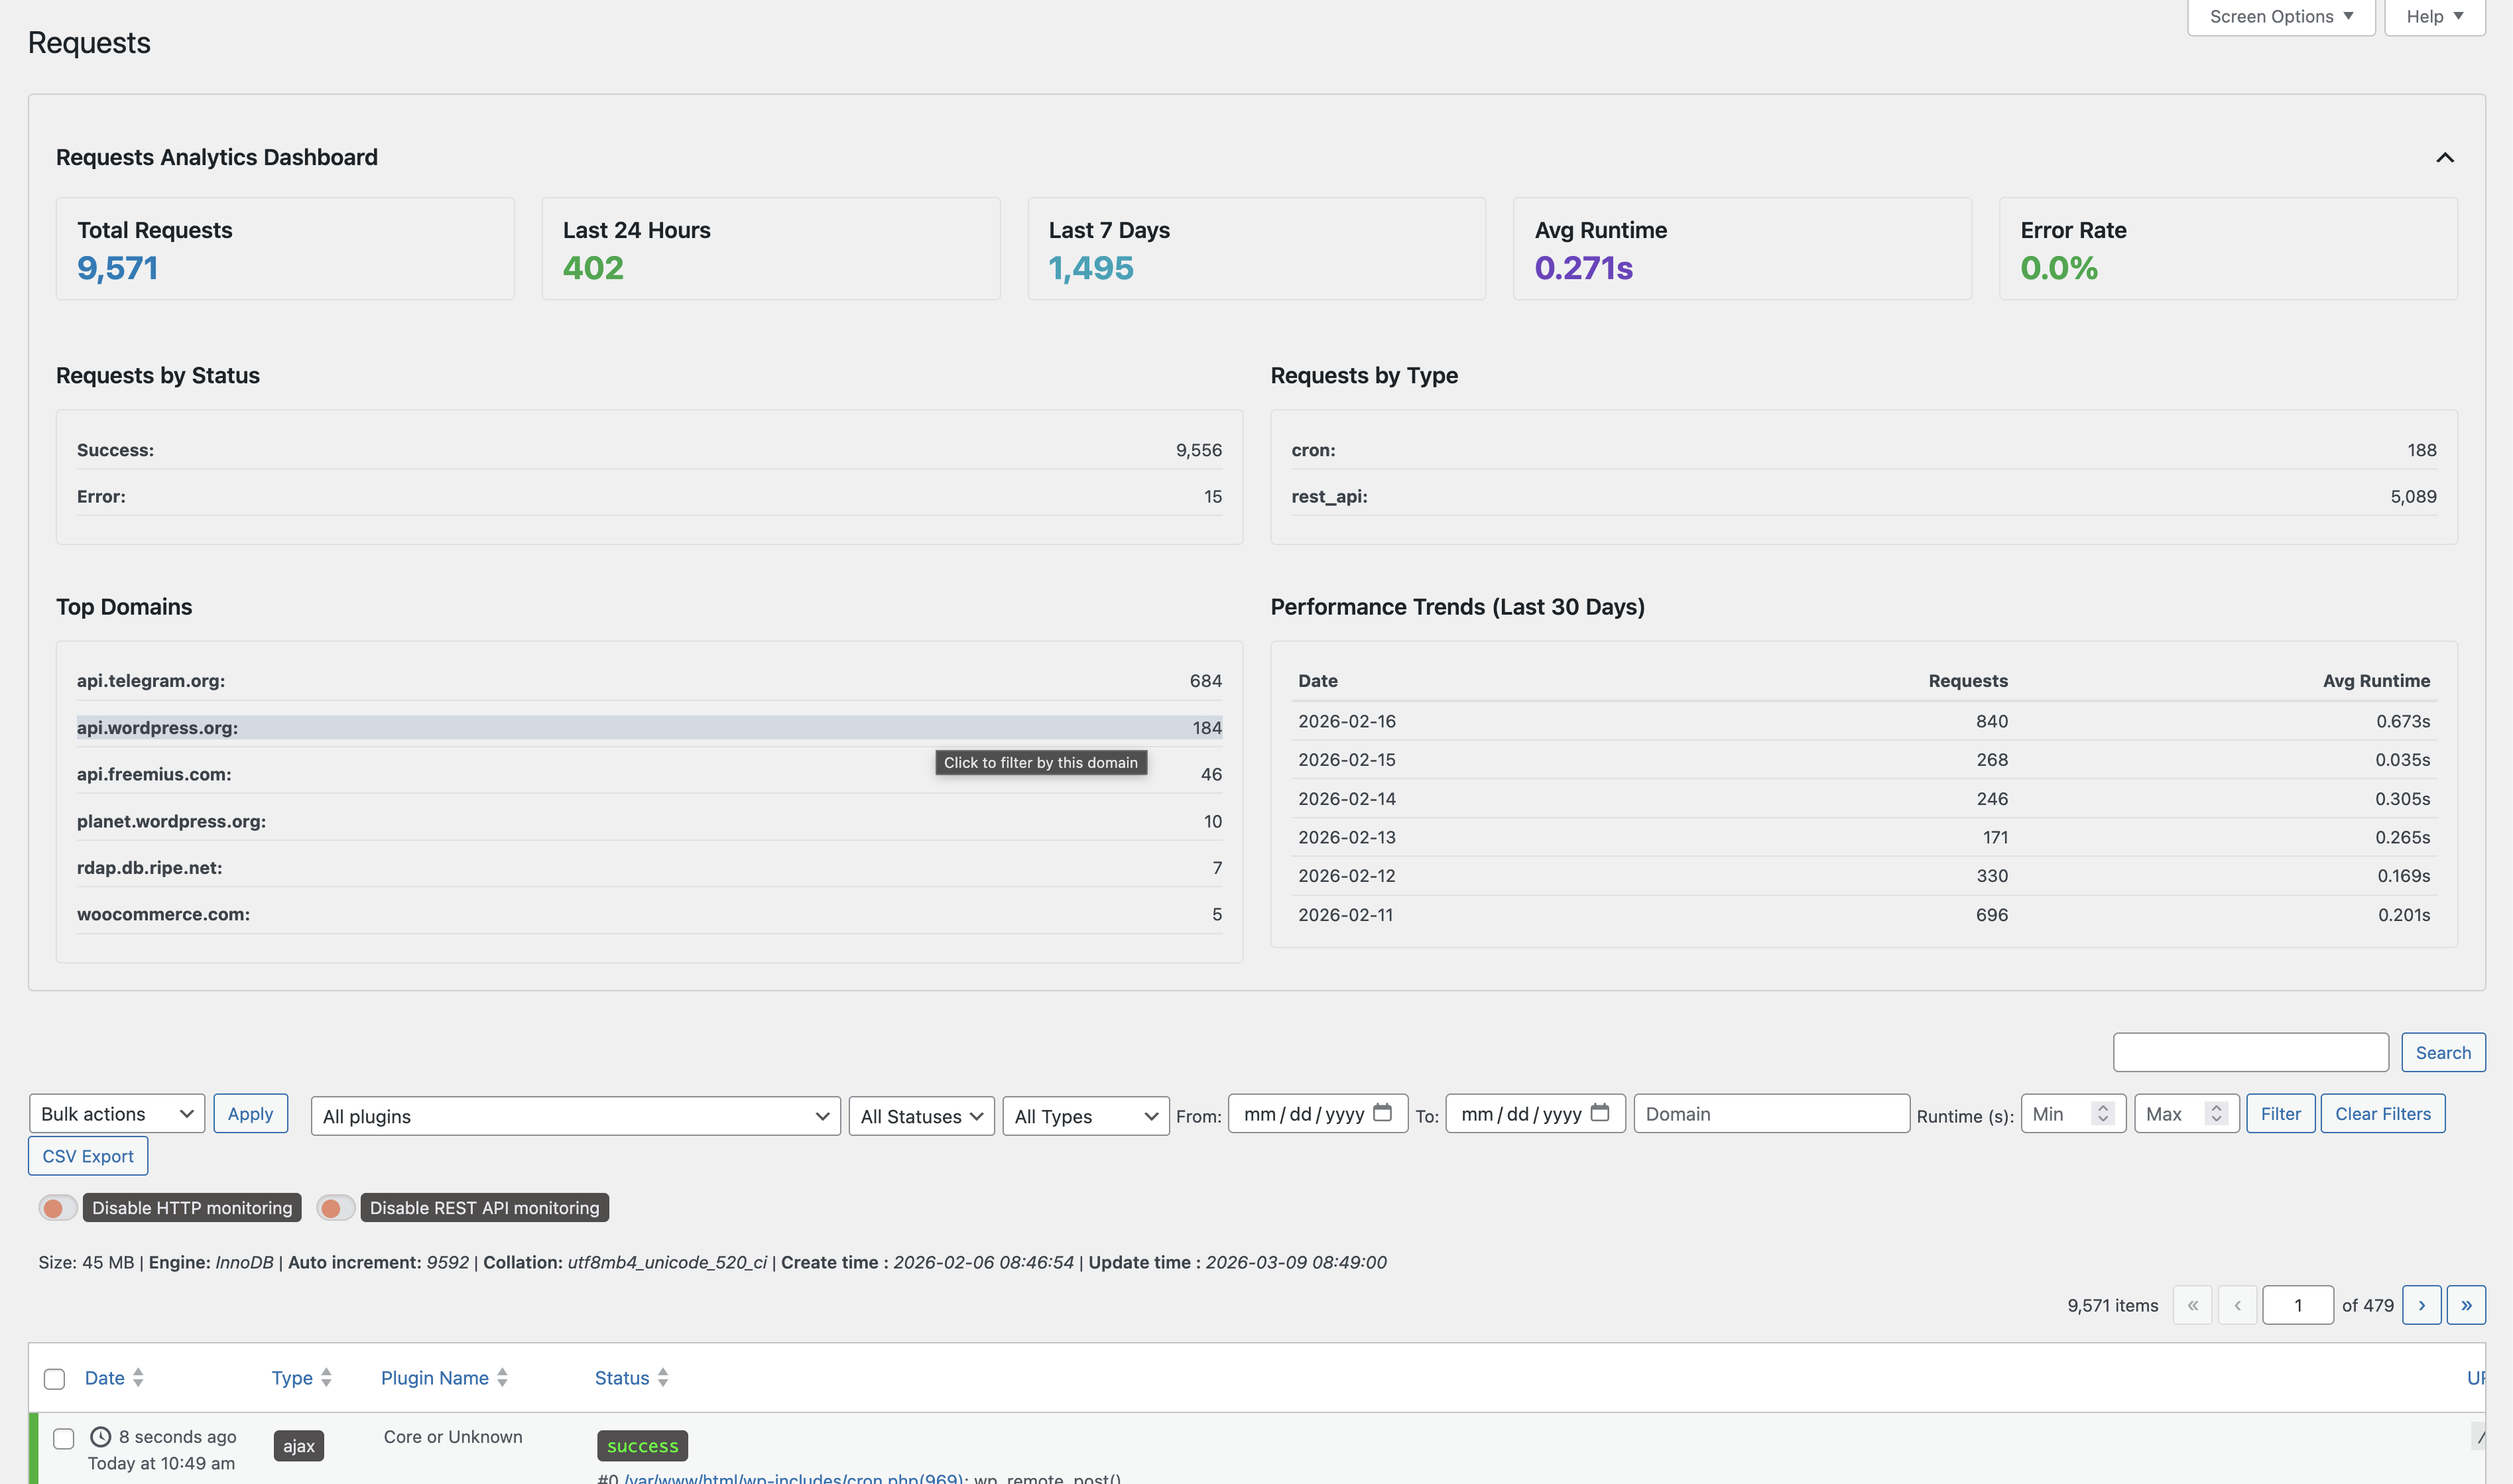
Outgoing HTTP Requests Viewer
Logs all outgoing wp_remote_* calls made by WordPress core, themes, and
plugins. Records URL, method, status code, response time, triggering plugin,
user, and full request/response detail. Export to CSV for external analysis.
Advanced filtering by domain, plugin, status, and date range.
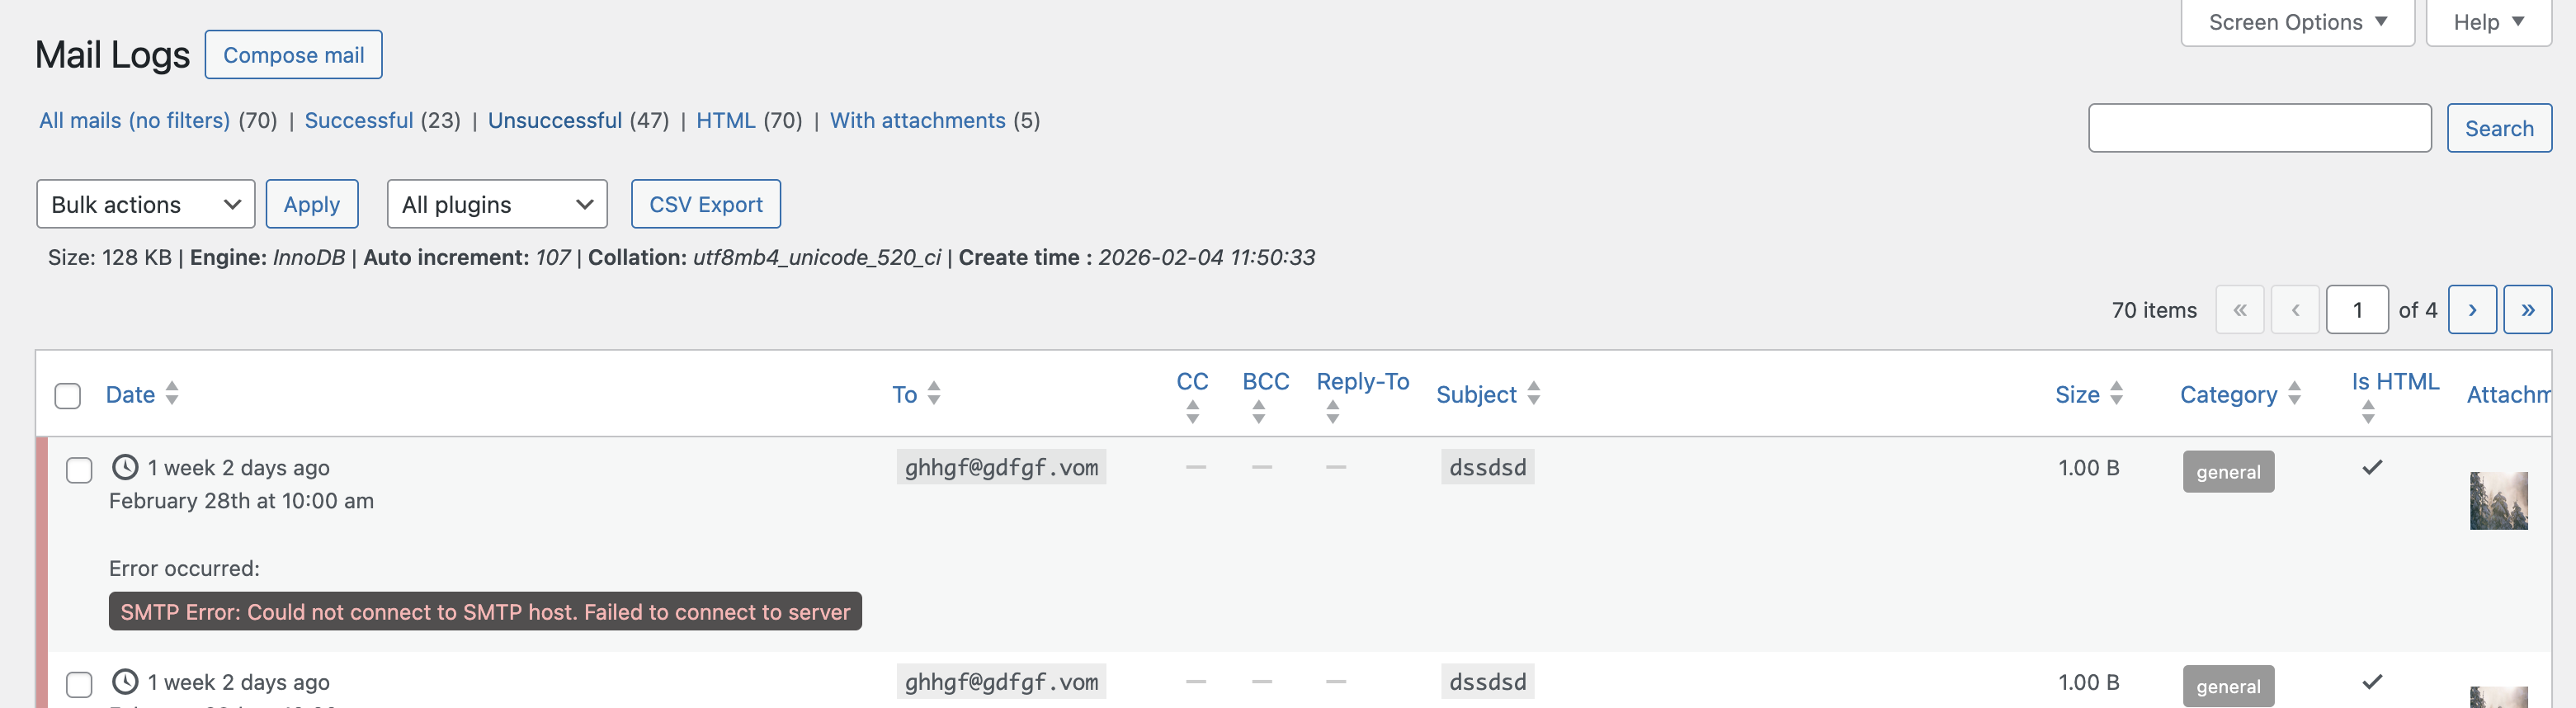
Mail Logger & Composer
Records every email sent through wp_mail() — including headers, body,
attachments, CC, and BCC — and stores it in a searchable log. View the
rendered email body, resend any logged email, or compose and send new emails
directly from the admin. Supports HTML and plain-text previews.
SMTP Configuration
Configure custom SMTP settings (host, port, encryption, username, password)
with a built-in test email tool. Optionally log SMTP debug output to the
WordPress debug log.
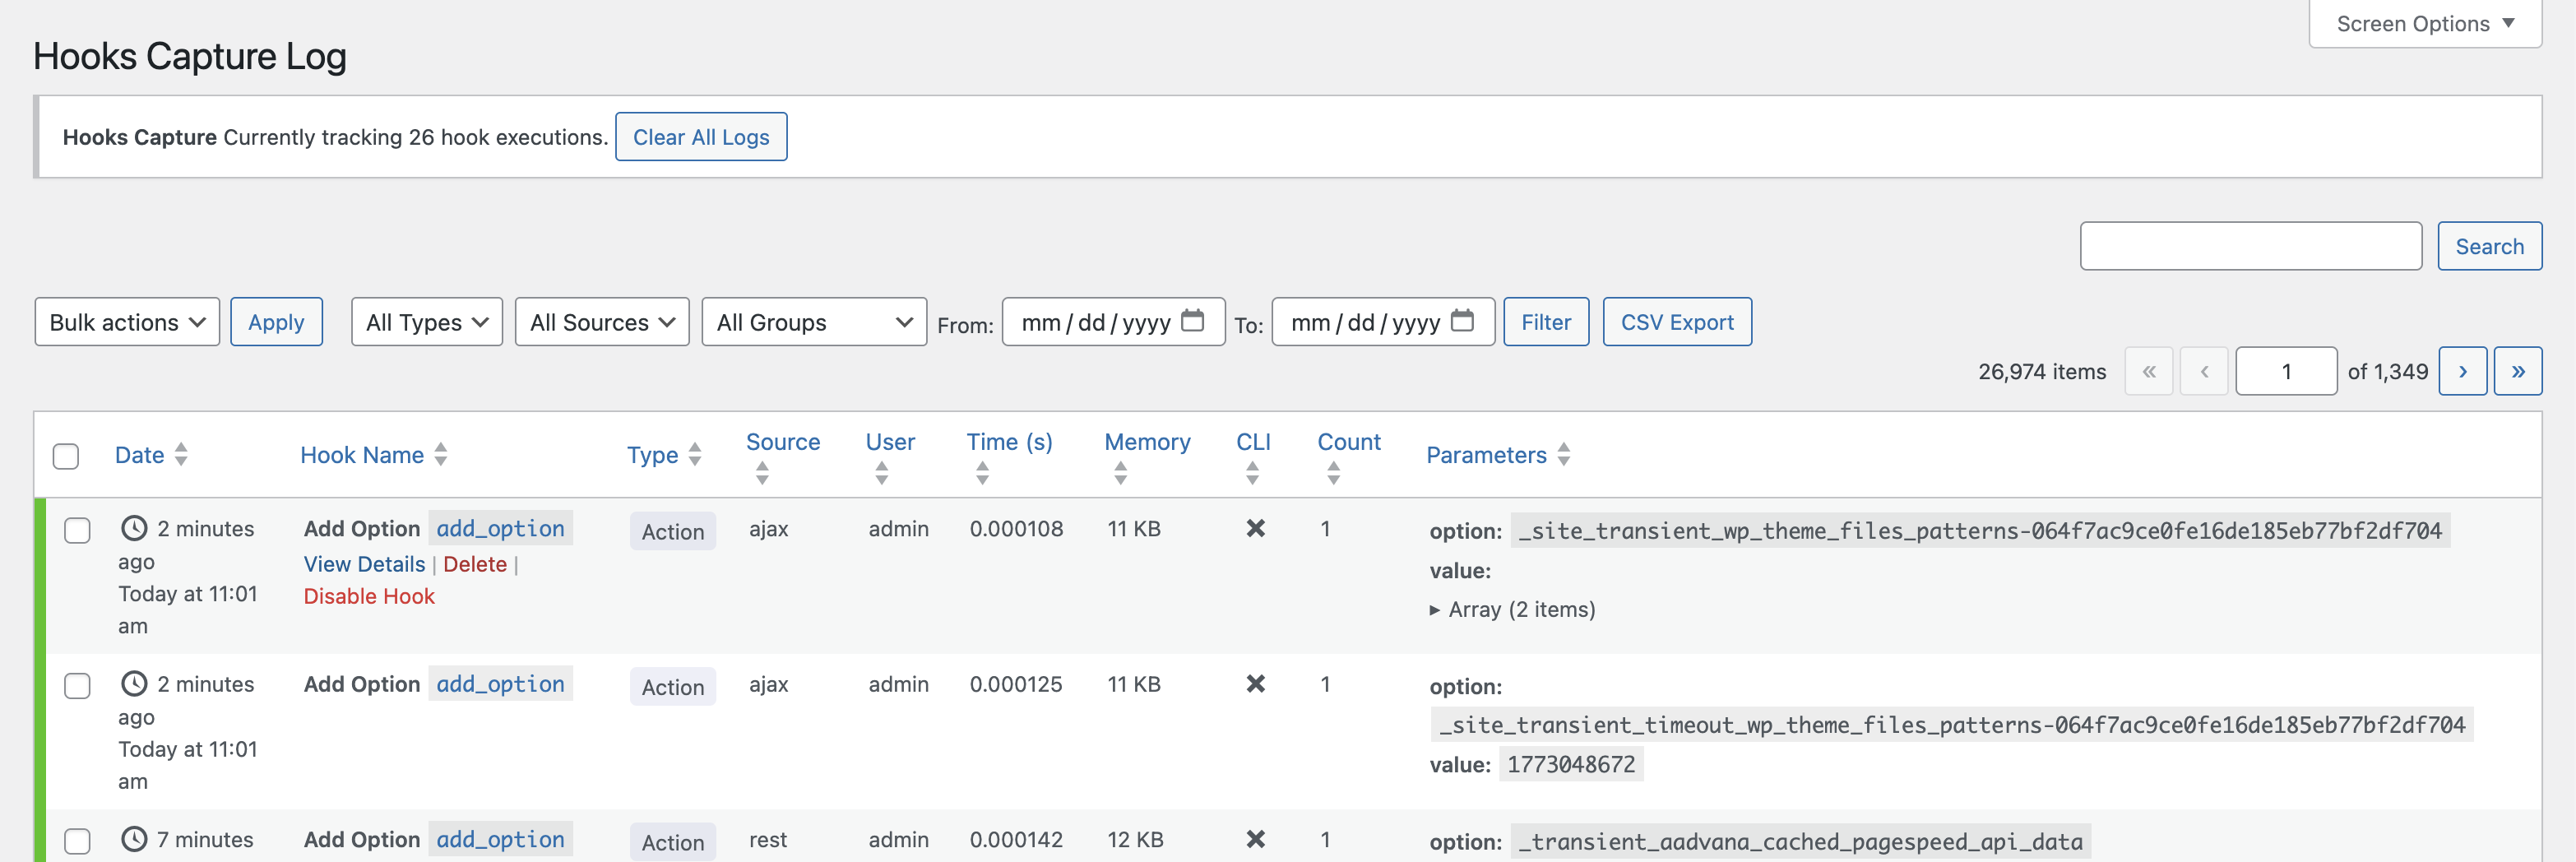
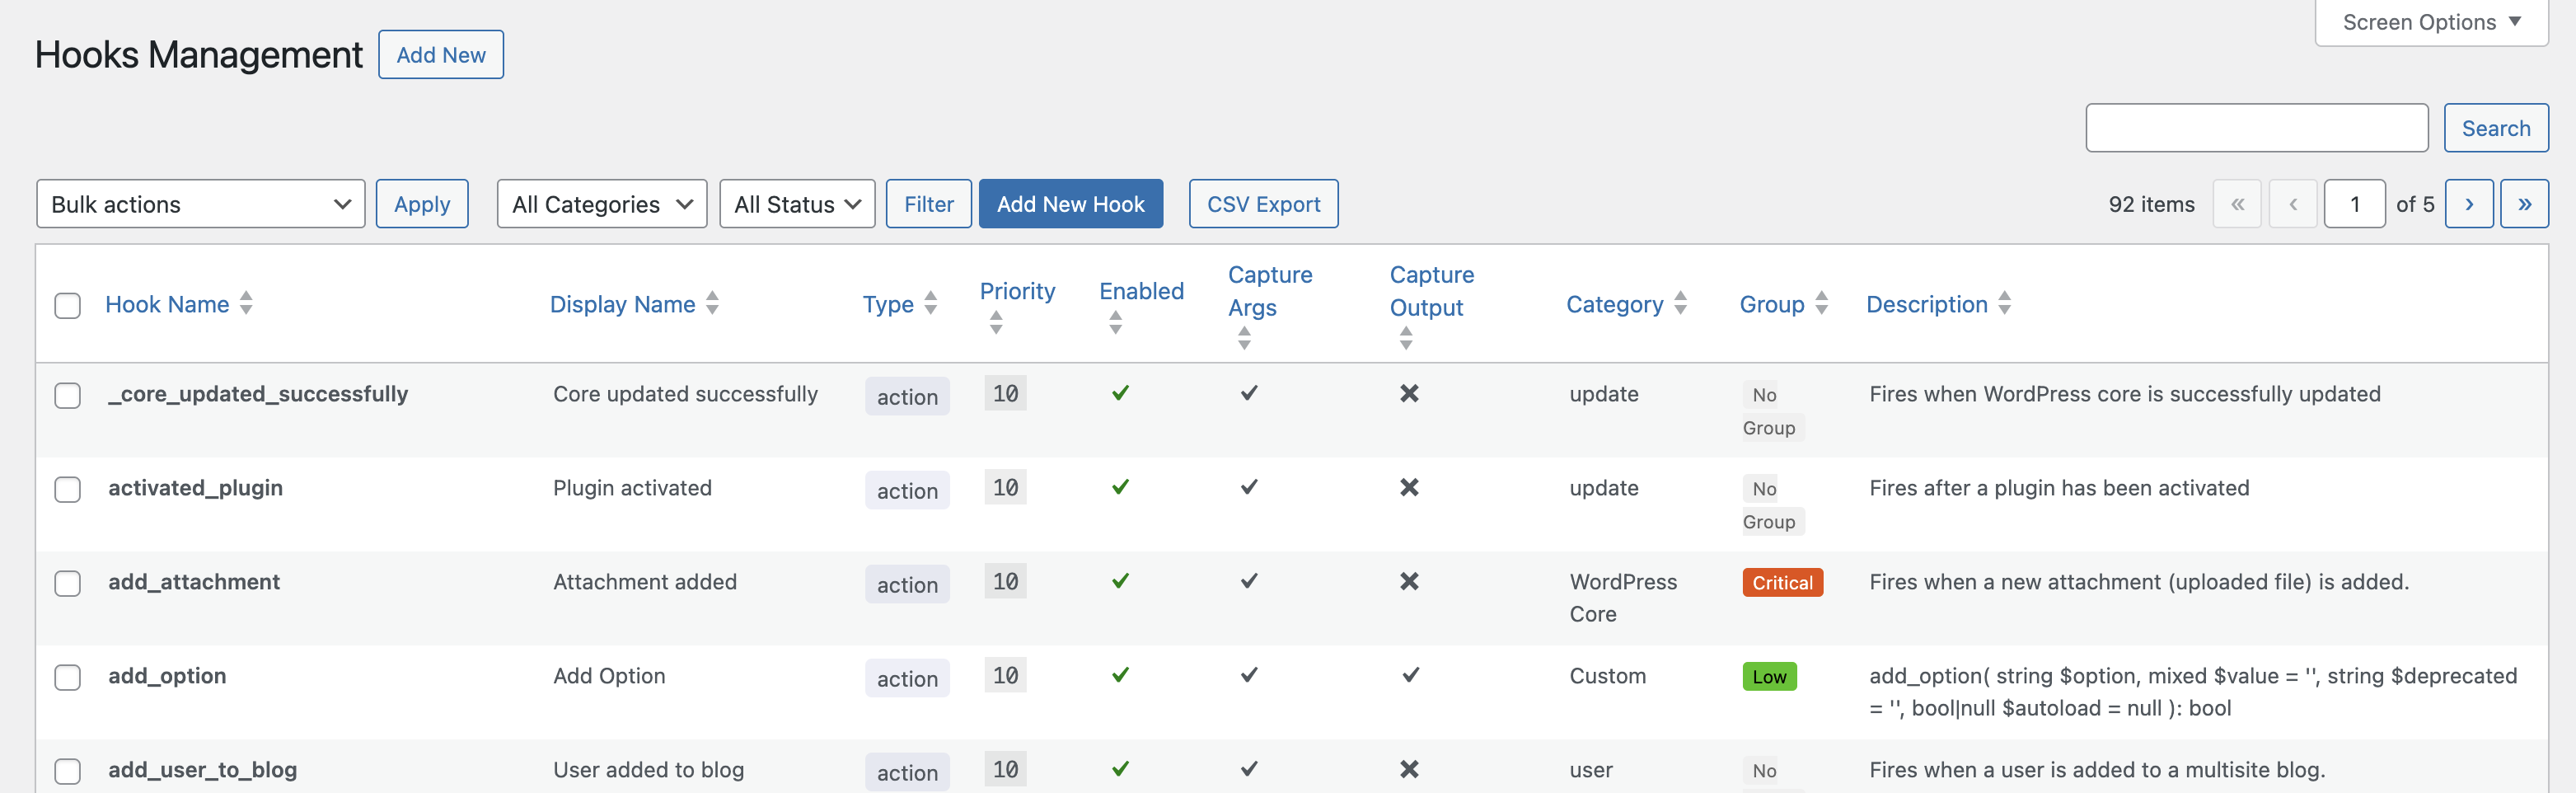
WP Hooks Monitor
Define which WordPress actions and filters (core or custom) you want to
observe. The Hooks Capture module records each invocation with its parameters,
return value (for filters), and a full stack backtrace. Organise monitoring
rules into named groups, enable/disable per hook, and review the captured
output in a dedicated list view.
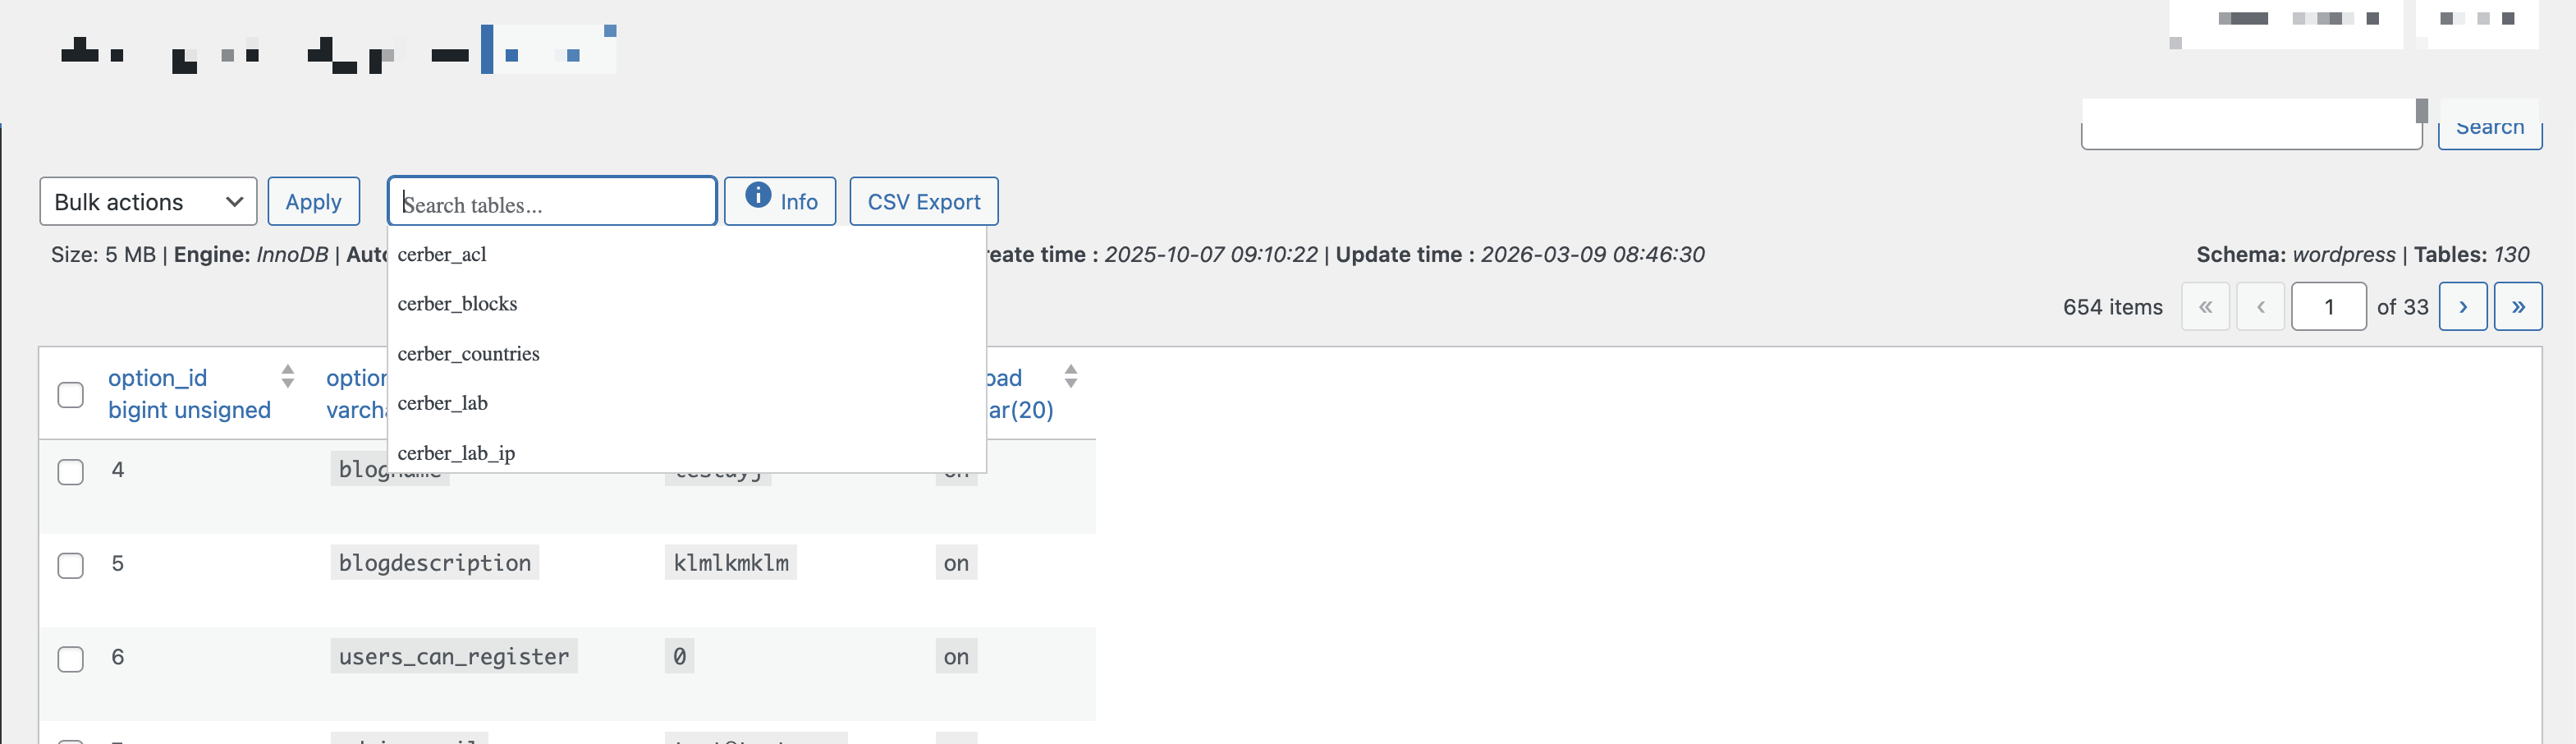
DB Table Manager
Browse, search, edit, and delete records across any table in your
WordPress database — including custom plugin tables. Displays table size,
engine, collation, row count, and schema information. Supports full and
filtered truncation and table drop with confirmation.
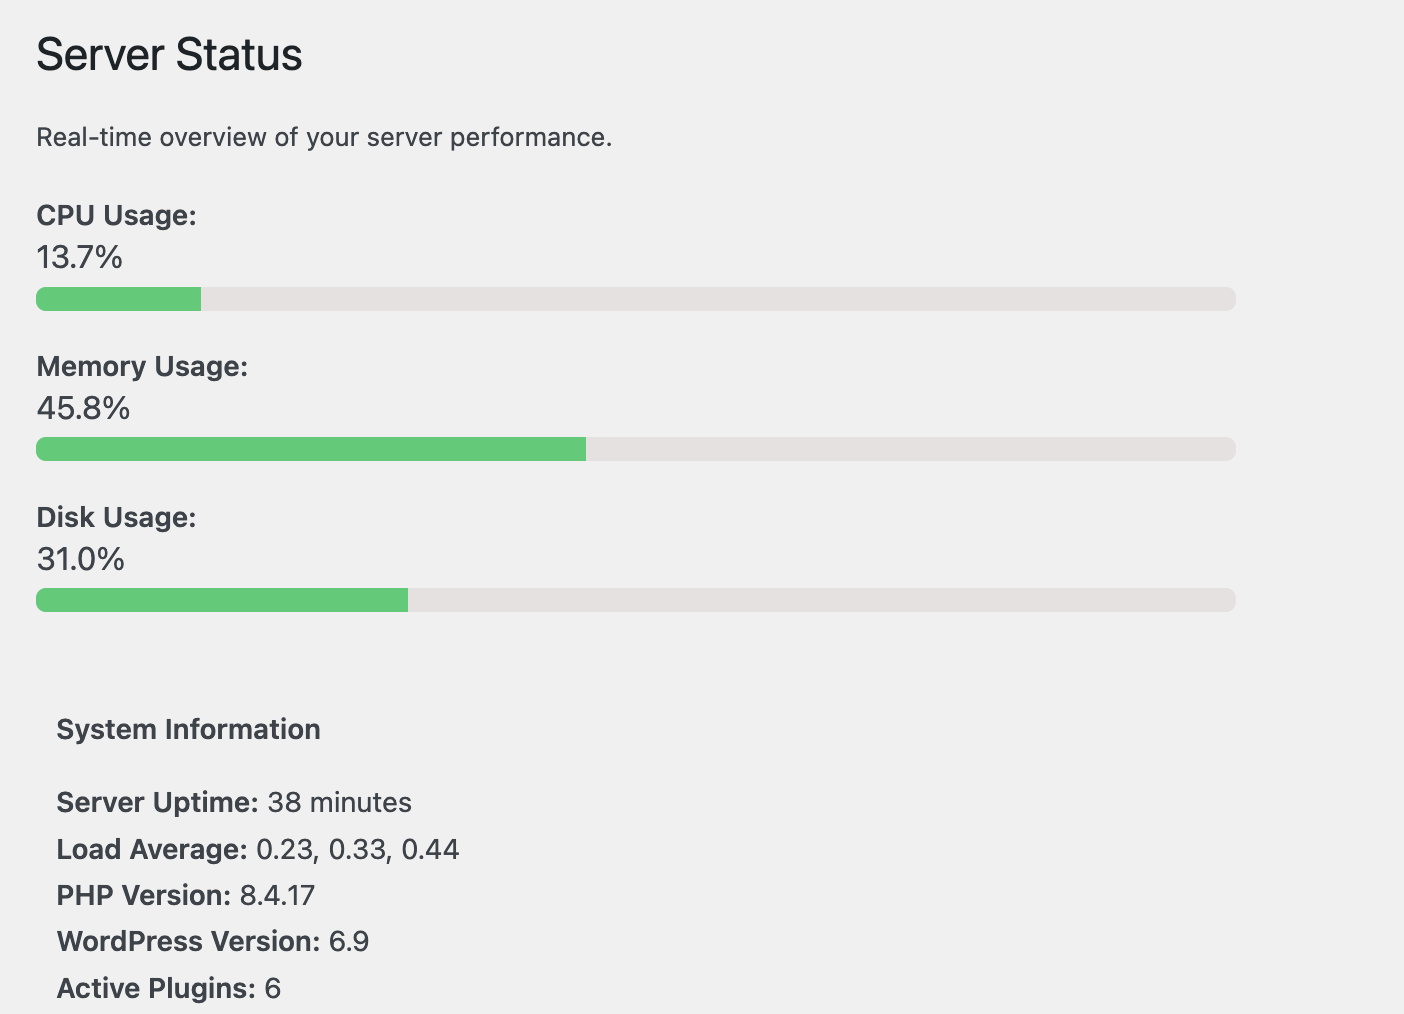
Server Info & System Status
Displays real-time server metrics (CPU load, memory usage, disk space,
PHP version, active extensions) as both admin-bar badges and a dashboard
widget. Also provides a detailed environment report useful for support tickets
and deployment checks.
Plugin Version Switcher
Roll back or switch between any previously downloaded version of an installed
plugin without leaving the admin. Useful for quickly reverting after a bad
update. Supports only free plugins from the WordPress repo.
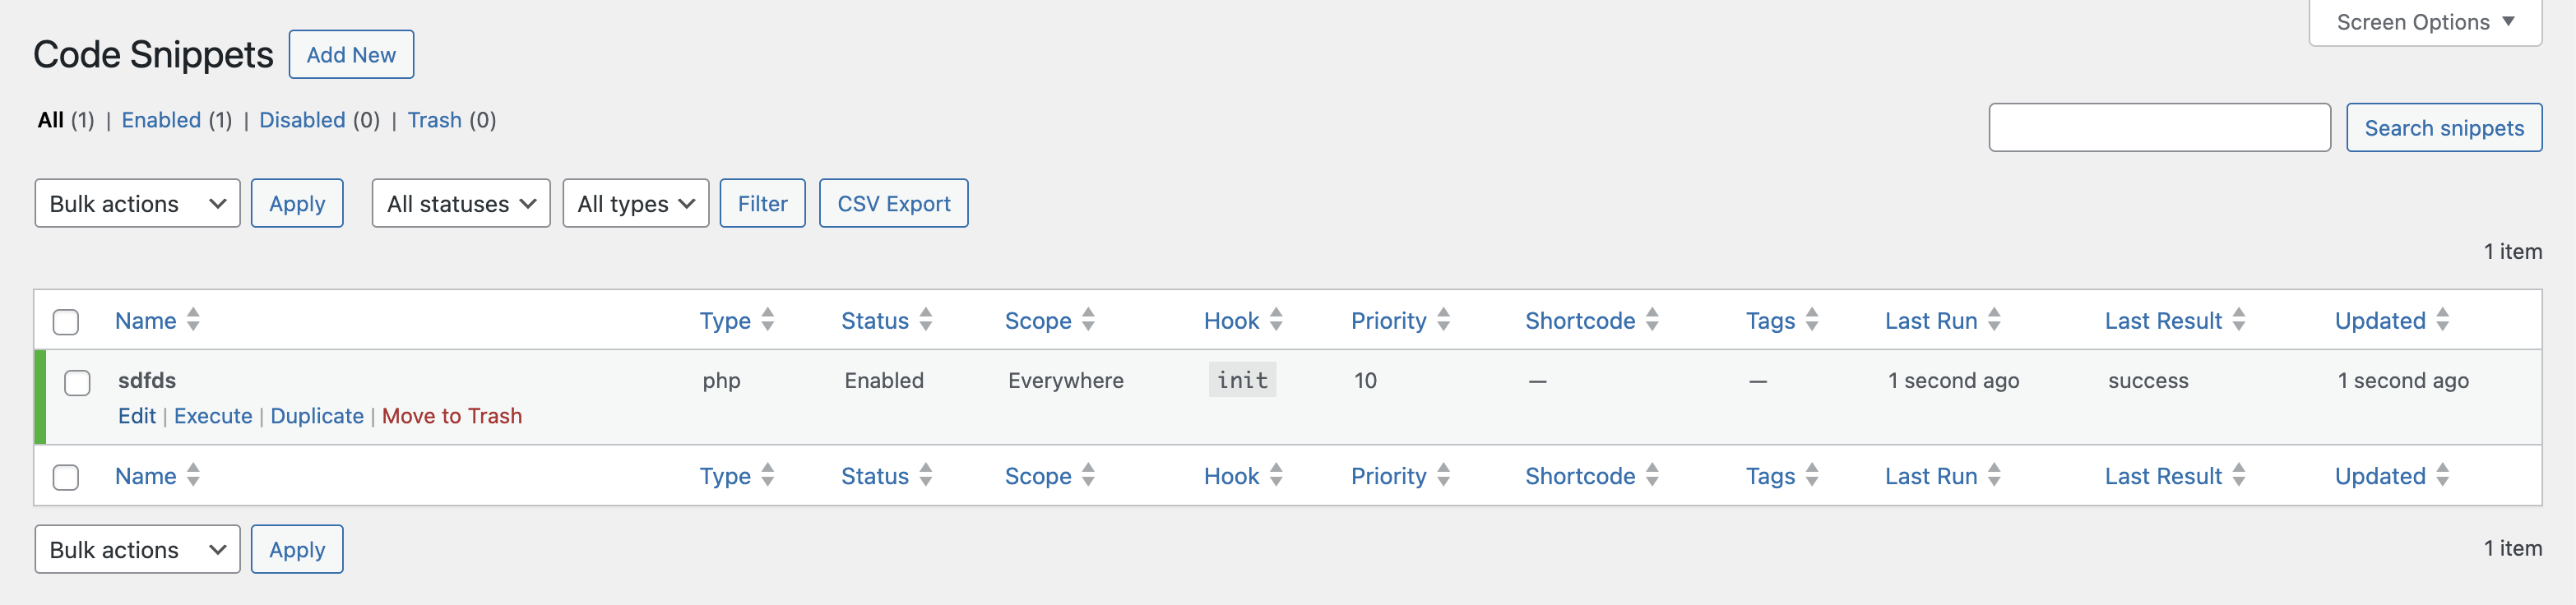
Code Snippets
Write, save, and execute custom PHP snippets from the admin. Snippets support
shortcodes, can be enabled/disabled individually, and are sandboxed before
execution. Useful for one-off data migrations, testing custom logic, or
generating dynamic output without creating a custom plugin.
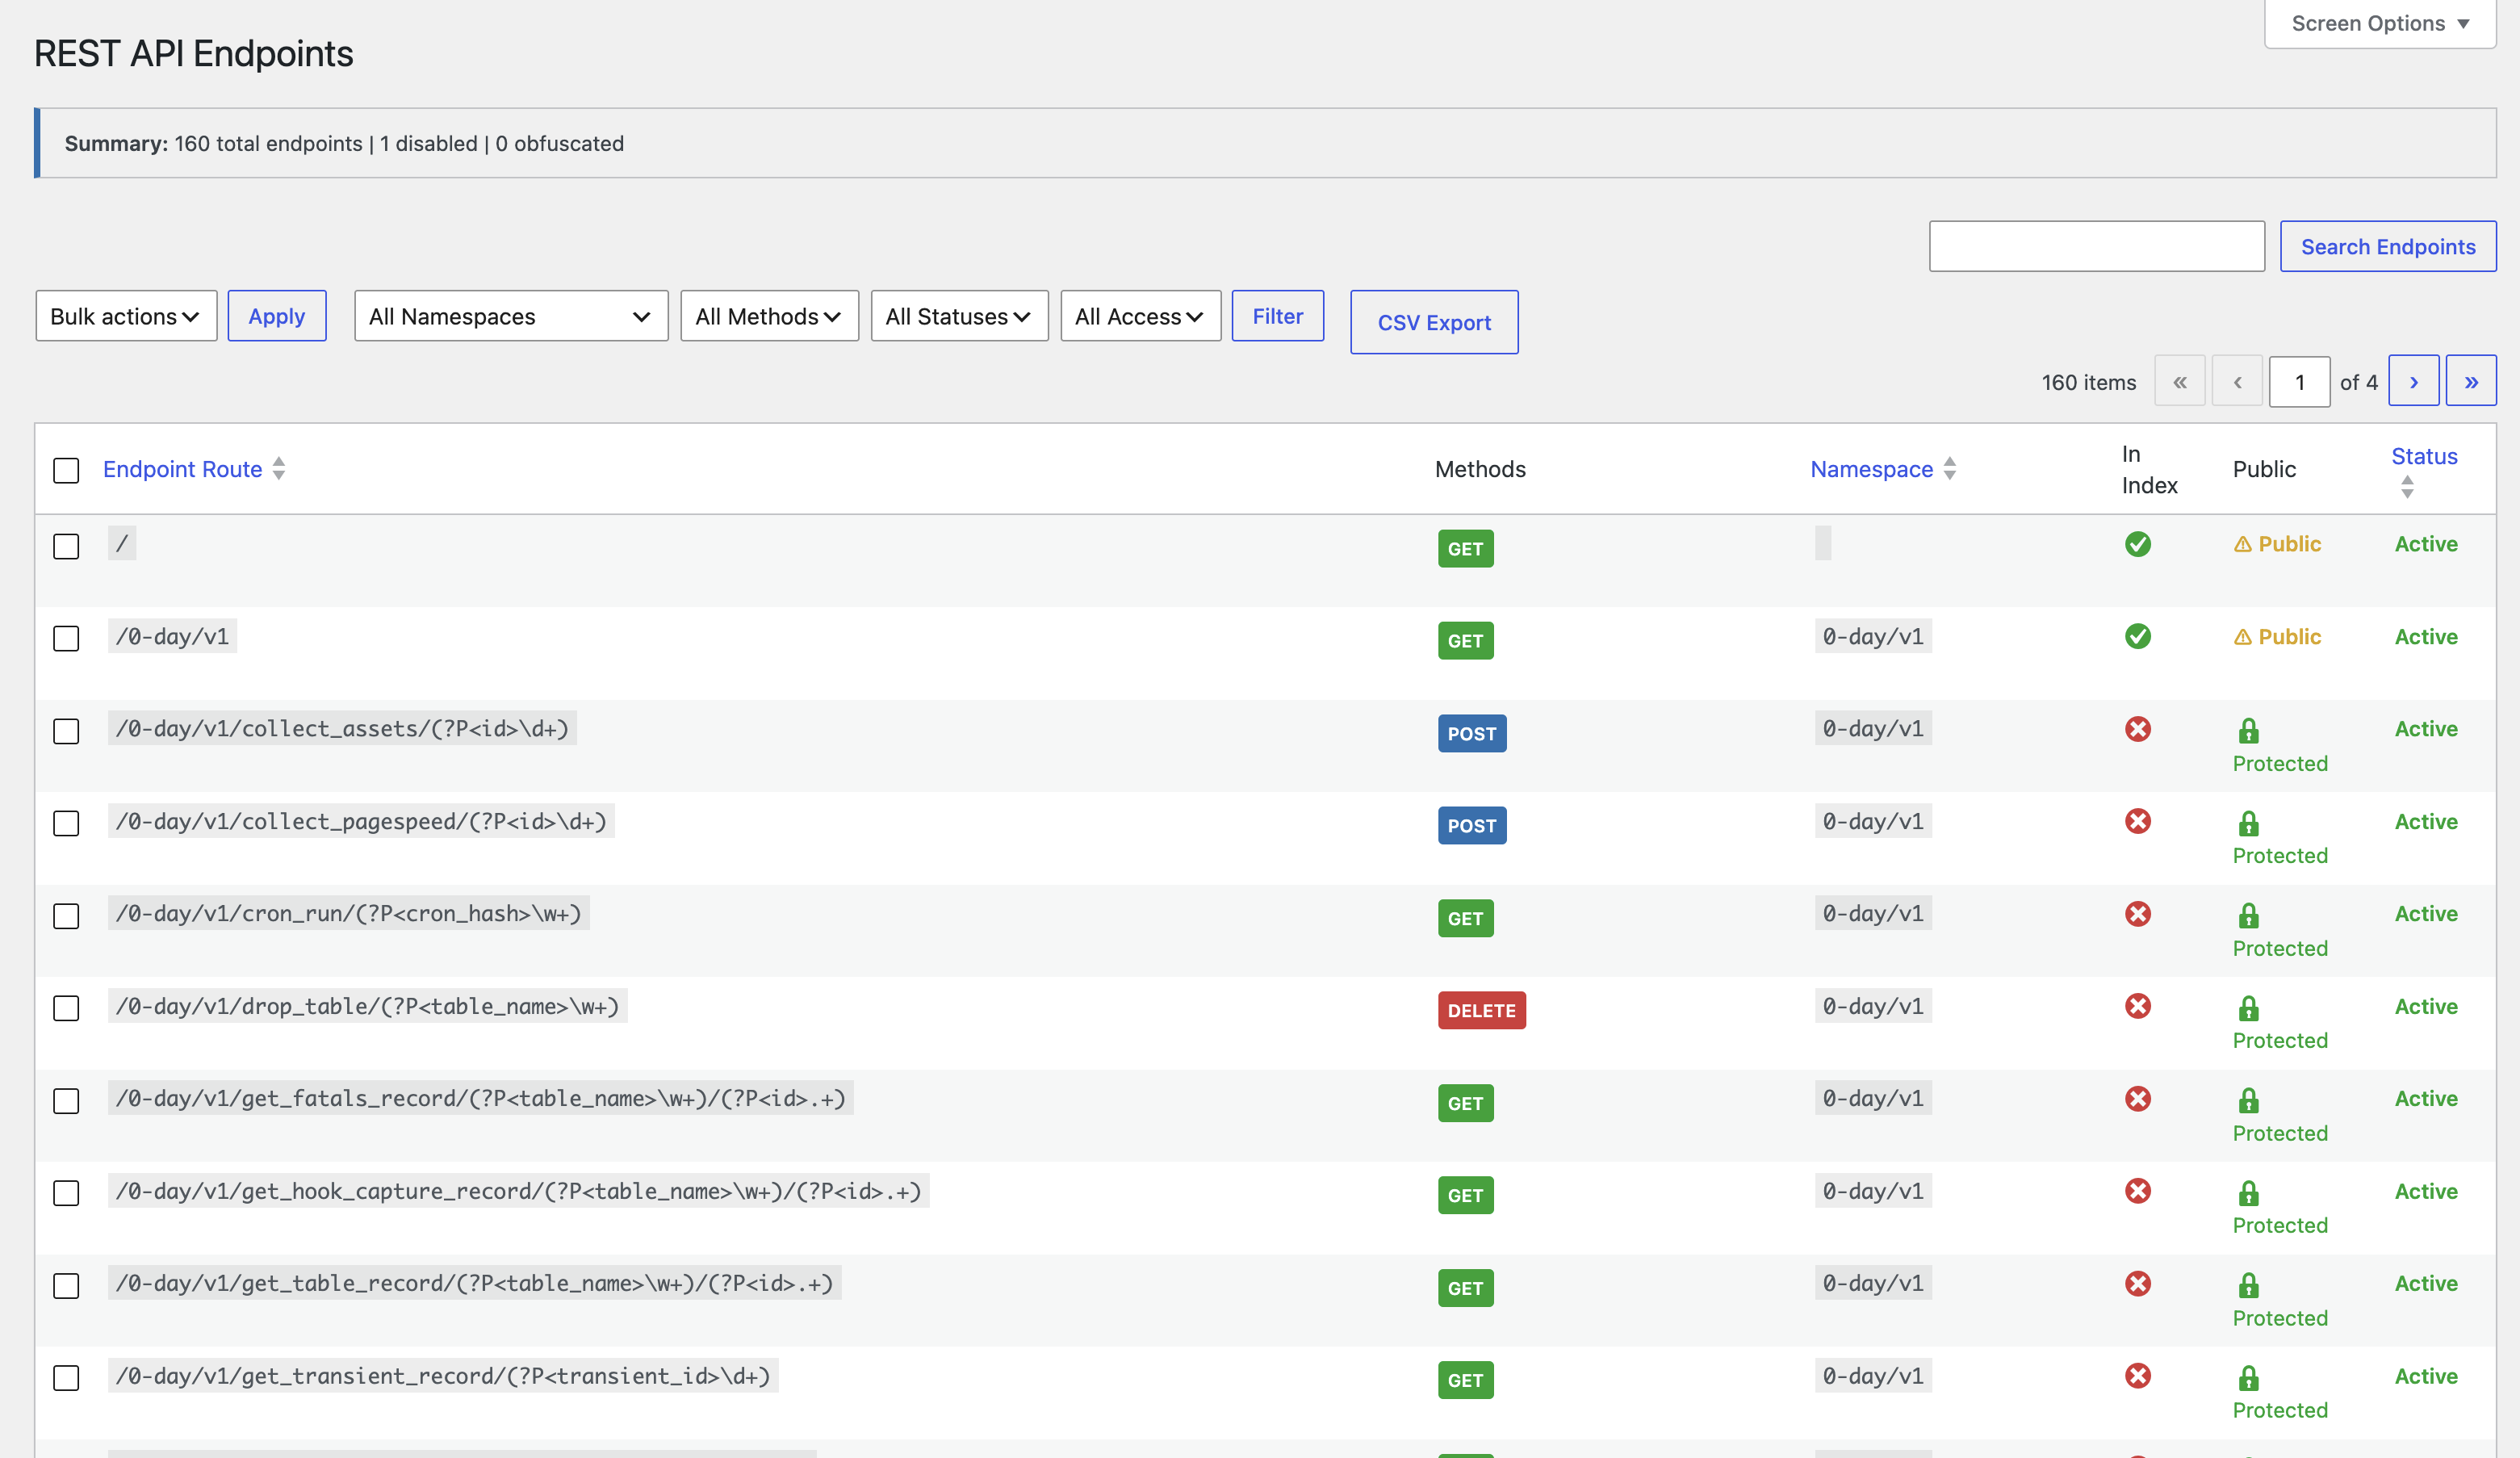
REST API Manager
A security and management tool that gives full visibility and control over
every registered REST API endpoint (/wp-json/). Inspect all registered
routes, disable individual endpoints, restrict HTTP methods, and hide routes
from discovery responses. Useful for hardening your site by removing
unnecessary API surface area.
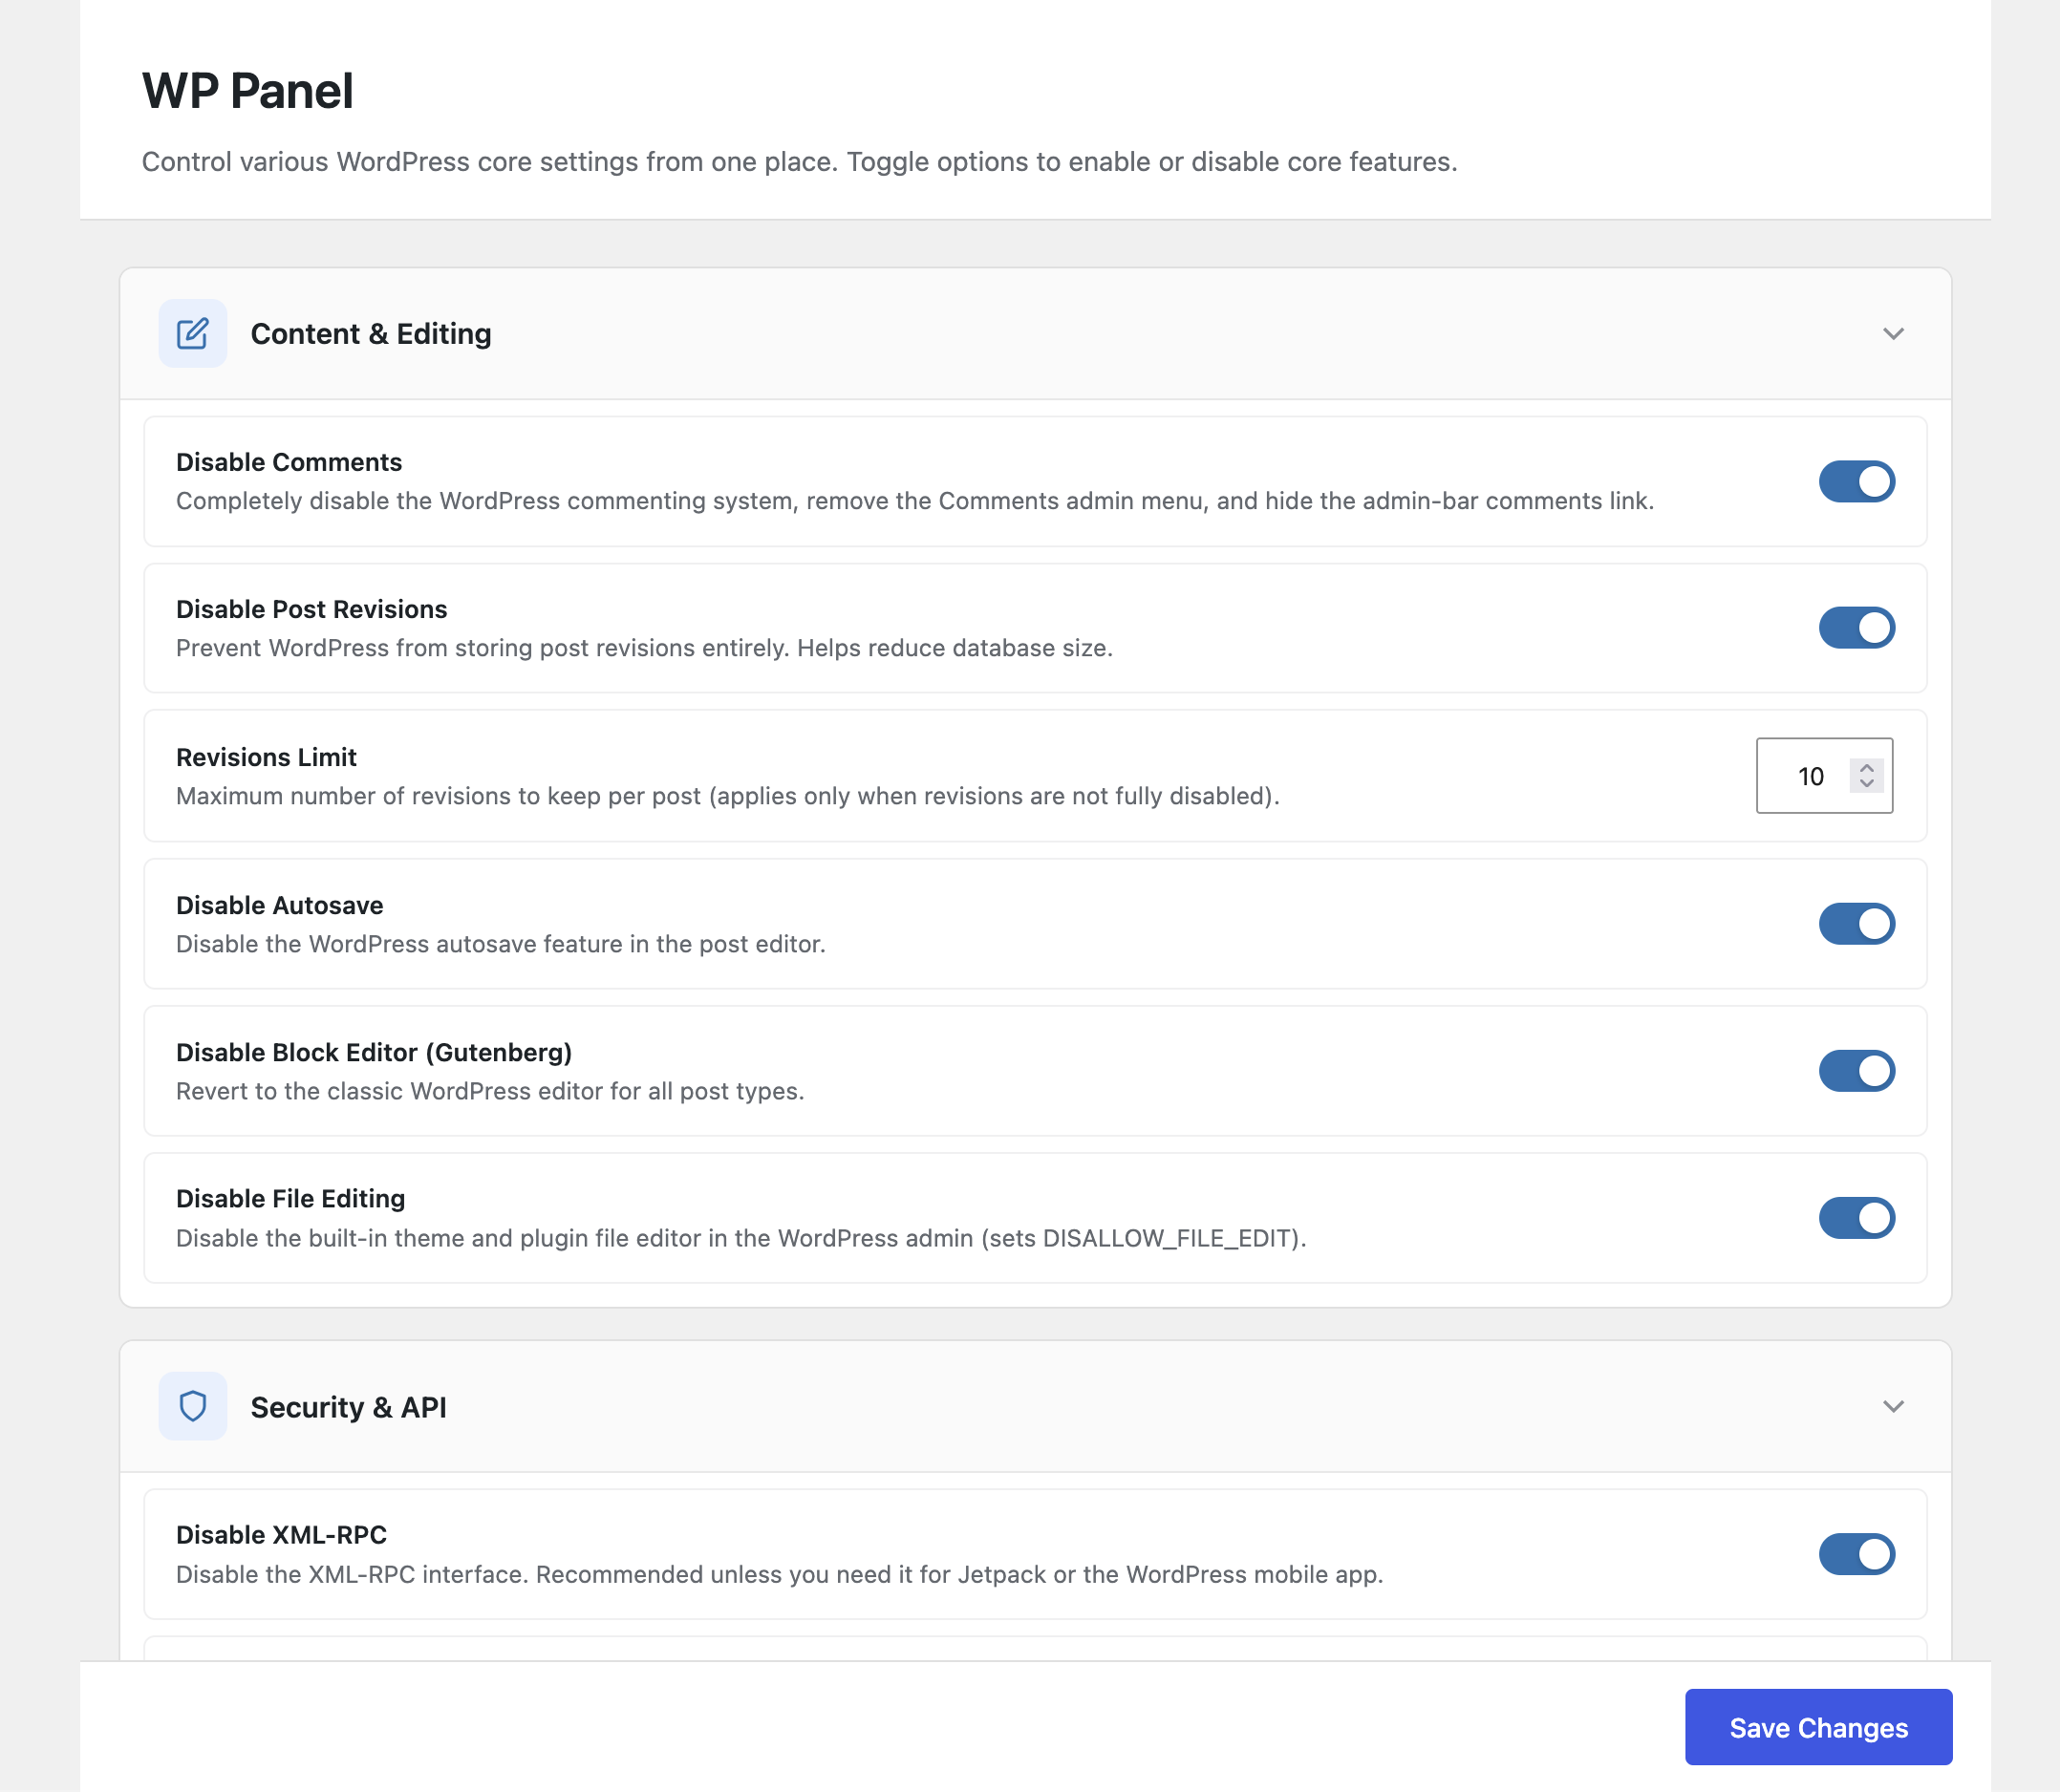
WP Panel
A centralised control panel for toggling WordPress core features and settings.
Enable or disable comments, revisions, auto-updates, XML-RPC, the REST API,
emojis, embeds, heartbeat behaviour, frontend asset loading, and more — all
from a single, organised admin page. No code changes or custom snippets
required.
Traffic Analytics
Privacy-focused website traffic monitoring built directly into WordPress — no external services or third-party scripts. Tracks unique visitors, pageviews, top pages, referrers, and technology breakdown (devices, browsers, operating systems) with a visual SVG-based dashboard. Choose between server-side (PHP) or client-side (JavaScript) tracking. Includes real-time visitor count automatic period comparison, configurable data retention, and a high-performance file-based write buffer.
Important: By default, Traffic Analytics uses server-side (PHP) tracking mode. This method is less accurate because it cannot distinguish bots from real visitors as effectively and may miss visitors served from full-page caches. If you need more precise analytics, switch to client-side (JavaScript) tracking in the module settings — this mode runs a lightweight script in the browser that provides significantly more accurate visitor detection and pageview counting.
Security Monitor
Real-time security event monitoring and threat detection for your WordPress
site. Tracks brute-force login attempts, burst rate limiting (DoS protection),
user enumeration attempts, and blocked requests. Displays a summary dashboard
with total events, critical alerts, blocked requests, and active incidents over
the last 7 days. Includes an Emergency Lockdown button to immediately restrict
site access during an active attack. Events are logged with severity level,
IP hash (privacy-preserving), attempt counts, and detailed request information.
Login & Auth Audit
Comprehensive authentication event logging that tracks all login activity on
your site. Records successful logins, failed login attempts, session expirations,
and password resets with full context — including user, IP hash, user agent,
and timestamp. Displays summary statistics (total events, successful logins,
failed logins, password resets) for the last 7 days. Supports filtering by
event type and severity, search, and CSV export.
Recovery Mode
Generate single-use recovery links that can disable a specific plugin or
trigger a custom action — delivered via Slack, Telegram, or any configured
webhook channel. Designed for emergency recovery when the site is inaccessible through normal means. The recovery URLs are sent in Slack and Telegram channels for security.
Other Features
- Dark mode for all admin screens.
- CSV export on all list views (requests, errors, mails, hooks, etc.).
- Screen Options on every screen (configure columns, items per page).
- WP CLI compatible scaffolding for background operations.
- Multisite aware (note: recovery mode has core multisite limitations).
Requirements & Compatibility
- WordPress 6.0+ (tested up to 6.9)
- PHP 7.4+ (compatible with PHP 8.0, 8.1, 8.2, 8.3, 8.4, 8.5)
- MySQL 5.7+ / MariaDB 10.3+
- Not intended as a primary multisite recovery tool (see FAQ)
Best Practices & Security Notes
- Keep log files outside the webroot when possible, or restrict access via
server rules (.htaccess / nginx) to prevent public exposure. - Use the built-in “Randomise Log Filename” feature when logs must stay in the
webroot. - All plugin capabilities are restricted to
manage_options(administrators)
by default. The menu can optionally be restricted to admins only. - Sanitize and escape all output; nonces are enforced on all state-changing
actions. - Secure SMTP credentials using TLS/STARTTLS; credentials are stored in the
WordPress options table. - Set file permissions tightly (e.g., 600/640) and restrict ownership to the
web server user. - Backup database and files before using bulk delete or table truncation.
- Disable unused modules to reduce footprint and potential attack surface.
- Disable or throttle high-frequency background polling on high-load sites.
Usage Notes & Performance
- The Error Log viewer reads the last N lines (default 100, max configurable
via Screen Options) to avoid full-file reads on GB-sized logs. - No pagination on error logs by design — pagination would force repeated
expensive full-file reads. - The PHP Fatal Error Tracker uses its own DB table; apply a retention policy
in Settings to avoid unbounded growth. - The Hooks Capture module adds minimal overhead per captured hook invocation;
disable capturing on production when not actively debugging. - The URL Tracker records page visits in a custom table; configure retention
or pause tracking on high-traffic sites.
Support & Notes
- Secure log paths and consider randomising filenames in production.
- Disable unused modules to reduce footprint and attack surface.
- Recovery Mode has limitations on multisite — test before relying on it.
- For bugs or feature requests, open an issue on the plugin page.
Live preview and full details:
https://wordpress.org/plugins/0-day-analytics/
Plugin website and documentation:
https://0-day-analytics.com
- Place the
0-day-analyticsfolder into/wp-content/plugins/(or install
via the Plugins screen or WP CLI). - Activate on the WordPress Plugins screen.
- Visit 0 Day in the admin menu and configure settings.
- Enable only the modules you need to minimise footprint.
- Recommended: test on staging before enabling on production.
Screenshot Gallery


Reading only the tail of the log avoids loading gigabytes of data into memory
on every page view. The number of lines to read is adjustable via Screen
Options on the Error Log screen.
Pagination would require seeking to arbitrary byte offsets in potentially
very large files on every page load. The tail-read approach is orders of
magnitude faster for the most common use case (seeing recent errors).
Go to 0 Day Settings Error Log and toggle “WP Debug Log Enabled”.
For best results, test the setting on a staging environment first.
Yes. In Settings Error Log, click “Generate WP Debug Log File Name”. A
cryptographically random filename will be written into wp-config.php,
making the log URL unguessable from the outside.
Most modules work correctly on multisite. The Recovery Mode feature has known
limitations related to WordPress core multisite behaviour — use with caution
and test on staging first.
No data is sent to any third-party service by the plugin itself. The Google
PageSpeed integration only fires when you explicitly click “Run PageSpeed
Analysis” and requires you to supply your own Google API key. Slack and
Telegram are opt-in notification channels for Recovery Mode.
Go to Settings and enter your Google PageSpeed Insights API key (free from
Google Cloud Console). You can then analyse any URL from Performance
PageSpeed or from the Performance URLs tab.
It runs 32+ automated checks including: PHP version currency, WordPress core
version, SSL certificate validity, WP_DEBUG exposure, file permissions,
database table prefix security, XML-RPC status, login URL predictability,
autoloaded options size, active plugin bloat, caching configuration, gzip
compression, lazy loading, image optimisation, cron health, and more. Each
check is scored and colour-coded with a recommended action.
The Error Log module reads your flat PHP error log file. The Fatal Error
Tracker stores fatal errors in a dedicated database table that persists across
log rotations and file truncations. Use both in combination: the log for
real-time detail, the tracker for long-term history. It will capture / store PHP errors even if WP_DEBUG is disabled, this way you will always be aware if something is wrong.
Yes. Go to Hooks Monitor and add a new monitoring rule specifying the hook
name (action or filter). From that point on, every invocation is recorded with
its arguments, return value, and full PHP backtrace. Rules can be grouped,
toggled, and removed without any code changes.
Go to Snippets, create a new snippet, write valid PHP, and save. You can
run it immediately, schedule it, or embed it as a shortcode. Snippets are
sandboxed before execution — a safety check blocks known dangerous patterns.
Use that feature with caution – if malformed or bad code is provided, it can break the site. Always test on non-production site first.
Yes. The Outgoing Requests Viewer logs all wp_remote_* calls site-wide.
Each record shows the requesting plugin, URL, HTTP method, response code, and
response time. This makes it easy to identify chatty plugins, unexpected
external calls, or slow API responses.
Use the Recovery Mode. Before the site breaks, generate a recovery link in
Settings Recovery Mode and deliver it to yourself via Slack, or Telegram. The link temporarily disables all the plugins, except 0-day-analytics so you can investigate what went wrong via a single-use token, allowing you to get back in.
Changelog
5.2.2
- Fixes problem with fatality on PHP v.8.0x – thanks to Lucian Padureanu for discovering this.
5.2.1
- Updated plugin to WordPress 7.0
5.2.0
- Dashboard page introduced — centralised overview with real-time widgets
for all active modules (Error Log, Fatal Errors, Cron Jobs, Transients,
HTTP Requests, WP Mail, REST API, Security). Now the default landing page
for the plugin menu. - Security Monitor module introduced — real-time security event monitoring
with brute-force detection, burst rate limiting (DoS protection), user
enumeration tracking, IP blocking, and Emergency Lockdown capability. - Login & Auth Audit module introduced — comprehensive authentication event
logging tracking logins, failures, session expirations, and password resets
with full user agent and IP hash context. - Bug fixes and performance optimisations across multiple modules.
5.1.0
- Traffic Analytics module introduced — privacy-focused website traffic
monitoring with visitors, pageviews, top pages, referrers, and device/browser/OS
breakdown. Includes real-time visitor count, SVG-based dashboard charts,
server-side and client-side tracking methods, file-based write buffer, and
configurable data retention. Disabled by default. - Error Log: added time-based filtering for more precise log analysis.
- Site Health: logic improvements and additional checks for more accurate
scoring. - Bug fixes and performance optimisations across multiple modules.
5.0.0
- Bug fixes, code and mobile version improvements
- REST API Manager module introduced — inspect all registered WordPress
REST API endpoints, disable individual routes, restrict HTTP methods, and
hide routes from discovery responses. - WP Panel module introduced — centralised admin page for toggling WordPress
core features (comments, revisions, auto-updates, XML-RPC, REST API,
emojis, embeds, heartbeat, frontend assets, and more). - Plugin website launched at https://0-day-analytics.com with full user
documentation.
4.9.0
- URL Tracker module introduced — automatically records visited page URLs with
visit counts, asset collection (JS/CSS/media with file sizes), and Google
PageSpeed integration per URL. - Performance page now includes a dedicated URLs tab with paginated list,
bulk delete, and per-record asset/PageSpeed refresh actions. - Site Performance & Security Scanner: 32+ automated checks with scored
dashboard (Security, Speed, Migration Readiness categories). - Google PageSpeed tab added to Performance page — analyse any URL for Core
Web Vitals, mobile and desktop scores, and Lighthouse category results. - Code quality improvements and security hardening throughout.
4.8.0
- Mail module: better capture capabilities, CC/BCC fields for mail sending,
option to resend a logged email. - Requests module: extended filtering, per-domain and per-plugin statistics,
CSV export. - File Manager: ZIP archive creation and extraction support.
- Code optimisations and refactoring.
4.7.0
- Hooks Monitor: bulk group assignment for monitoring rules. Bug fixes and
code optimisations.
4.6.0
- Hooks Monitor: UI improvements and small styling fixes.
4.5.2
- Fixed hooks quick-action enable/disable. Fixed rendering of human-readable
data when a core object is captured by ID only.
4.5.1
- Fixed settings save and debug log file name handling.
4.5.0
- Hooks Capture / Monitor module introduced. Bug fixes and code improvements.
4.4.1
- Small bug fixes and File Manager improvements.
4.4.0
- DB Table Manager gains record insertion capability.
4.3.1
- Fixed problem with saving a snippet for the first time.
4.3.0
- WordPress 6.9 compatibility. Performance tweaks. Code Snippets module added.
4.2.1
- Minor fixes and environment compatibility improvements.
4.2.0
- New filters and editor/file tools.
4.1.1
- Optimisations and bug fixes.
4.1.0
- Code optimisations and bug fixes.
4.0.0
- DB Table edit introduced. File editor (experimental) introduced. Multiple
bug fixes and code optimisations.
Earlier versions
- Progressive additions: mail logger, PHP fatal error table, cron and
transient managers, CSV export, recovery mode, plugin version switcher,
UI and dark-mode improvements.
" width="120" height="120">
Available Versions
| Version | Download | Type |
|---|---|---|
| 5.2.2 | Download | Stable |
| 5.2.1 | Download | Stable |
| 5.2.0 | Download | Stable |
| 5.1.0 | Download | Stable |
| 5.0.0 | Download | Stable |
| 4.9.0 | Download | Stable |
| 4.8.0 | Download | Stable |
| 4.7.0 | Download | Stable |
| 4.6.0 | Download | Stable |
| 4.5.2 | Download | Stable |
| 4.5.1 | Download | Stable |
| 4.5.0 | Download | Stable |
| 4.0.0 | Download | Stable |
| Development | Download | Trunk |